Forecasting and Anomaly Detection in Large-Scale Time Series
Priyanga Dilini Talagala
26/01/2023
pridiltal
prital.netlify.app
The slides are powered by xaringan R package
Acknowledgement

High Dimensional data
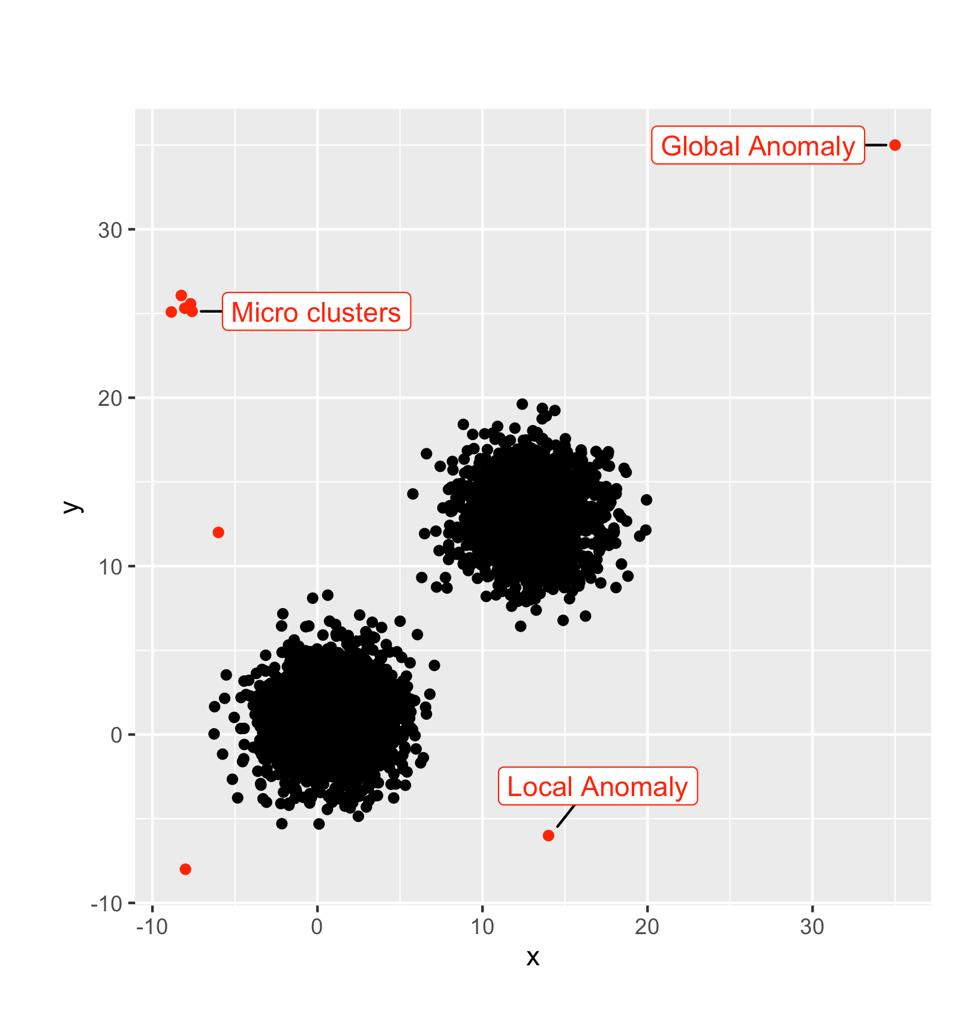
High Dimensional data

Temporal data
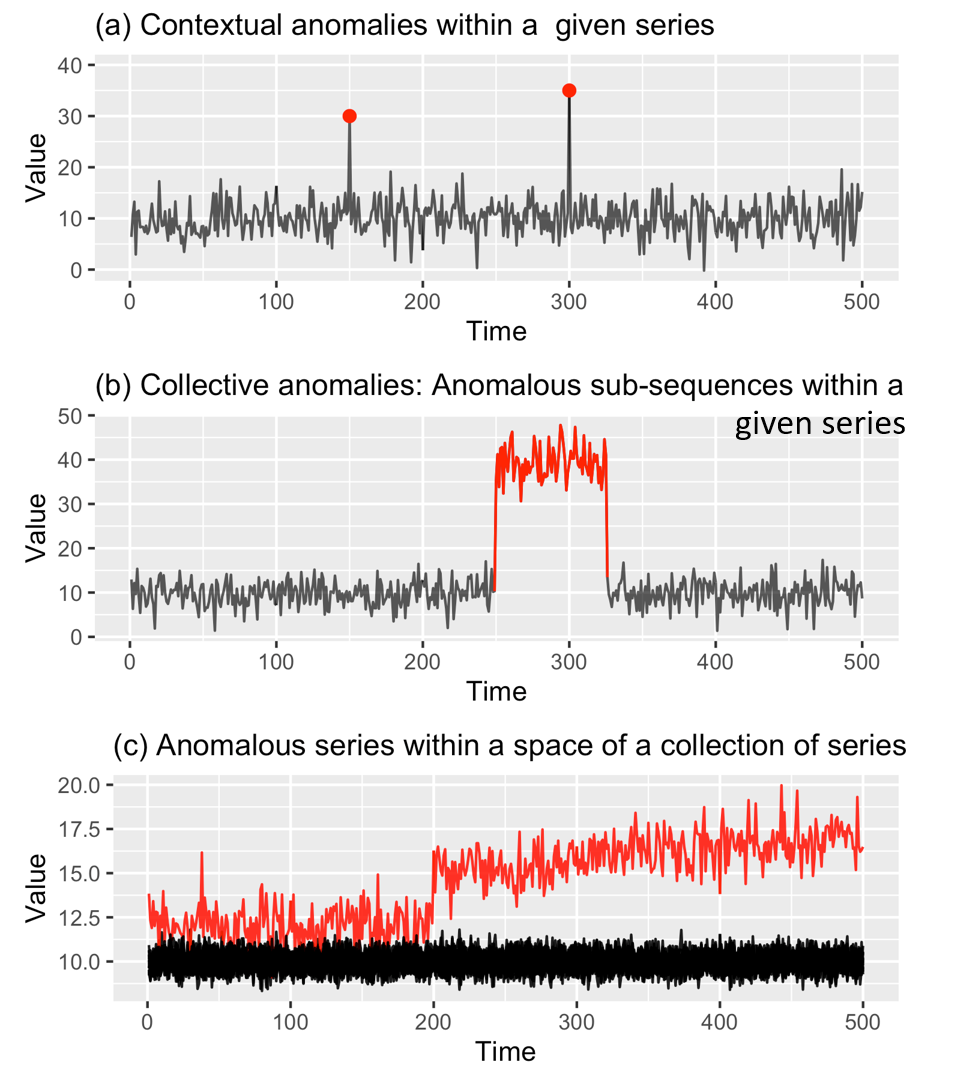
Anomalies in temporal data
Anomalies in temporal data
Anomalous series within a space of a collection of series
- All these applications generate millions or even billions of individual time series simultaneously
- All these applications generate millions or even billions of individual time series simultaneously
- Research question: Finding anomalous time series within a large collection of time series
- All these applications generate millions or even billions of individual time series simultaneously
- Research question: Finding anomalous time series within a large collection of time series
- Approaches to solving the problem of anomaly detection for temporal data :
- All these applications generate millions or even billions of individual time series simultaneously
- Research question: Finding anomalous time series within a large collection of time series
- Approaches to solving the problem of anomaly detection for temporal data :
Batch scenario
- whole set of data is available
- complete events
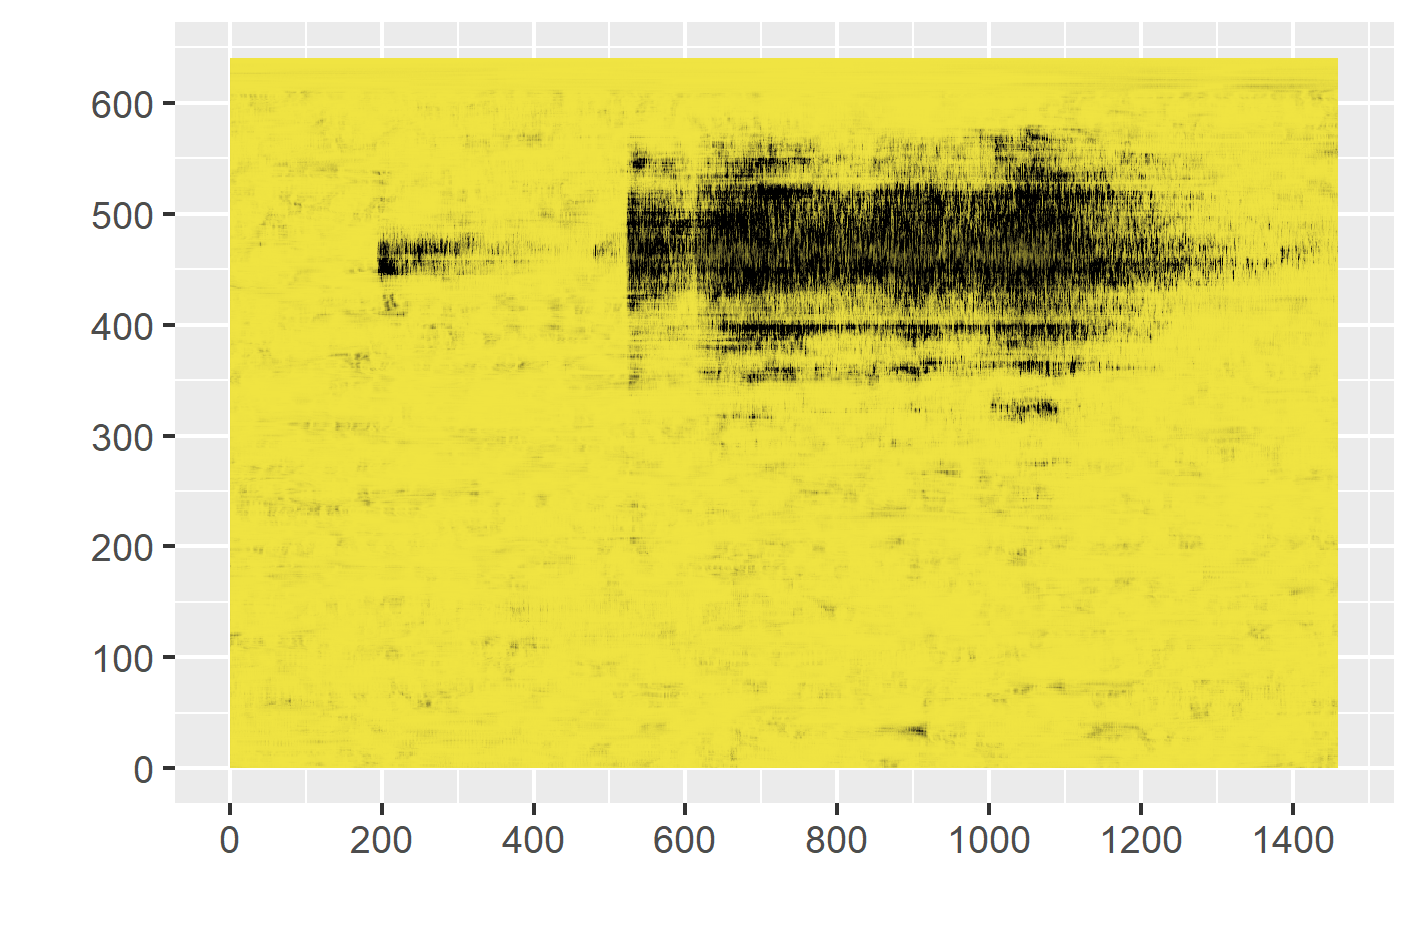

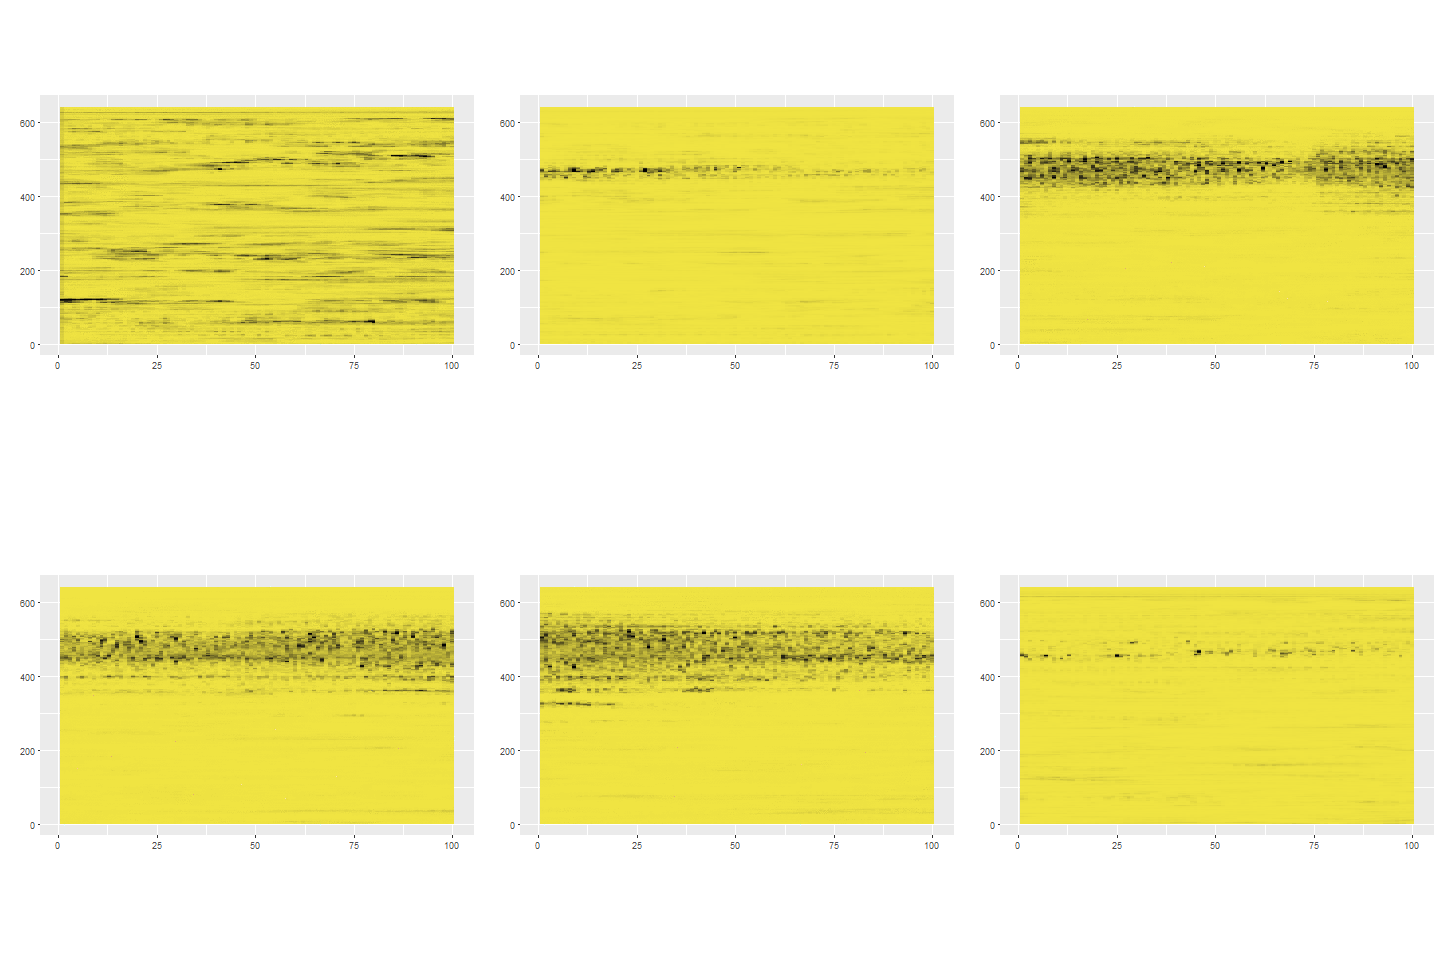
Data stream scenario
- continuous, unbounded, flow at high speed, high volume
- incomplete events
stray (Search and TRace AnomalY)

on CRAN
devtools::install_github("pridiltal/stray")
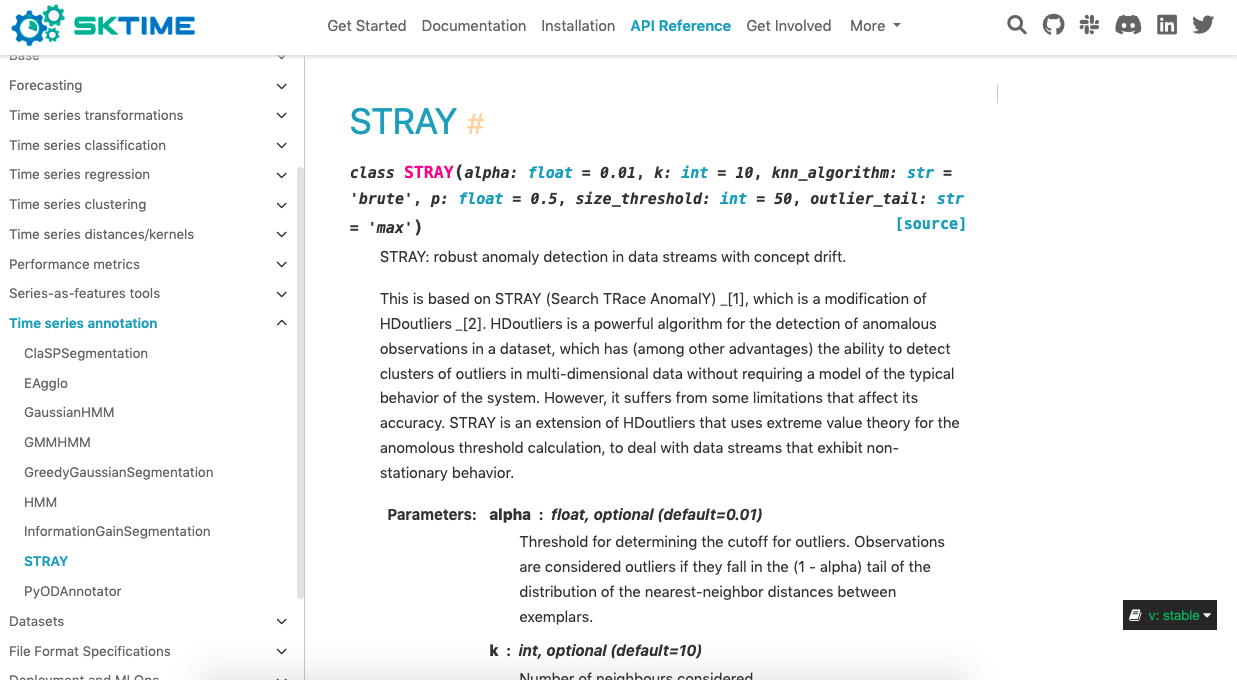
Stray algorithm in Python
Recently, Kate Buchhorn has ported stray algorithms to Python and made it available in sktime:
Anomaly detection in high dimensional data
Main contributions
- Propose a framework to detect anomalies in high dimensional data. Our proposed algorithm addresses the limitations of HDoutliers algorithm (Wilkinson, 2018).
Anomaly detection in high dimensional data
Main contributions
- Propose a framework to detect anomalies in high dimensional data. Our proposed algorithm addresses the limitations of HDoutliers algorithm (Wilkinson, 2018).
What is an anomaly ?
- We define an anomaly as an observation that deviates markedly from the majority with a large distance gap.
Main assumptions
- There is a large distance between typical data and the anomalies in comparison to the distance among typical data.
stray
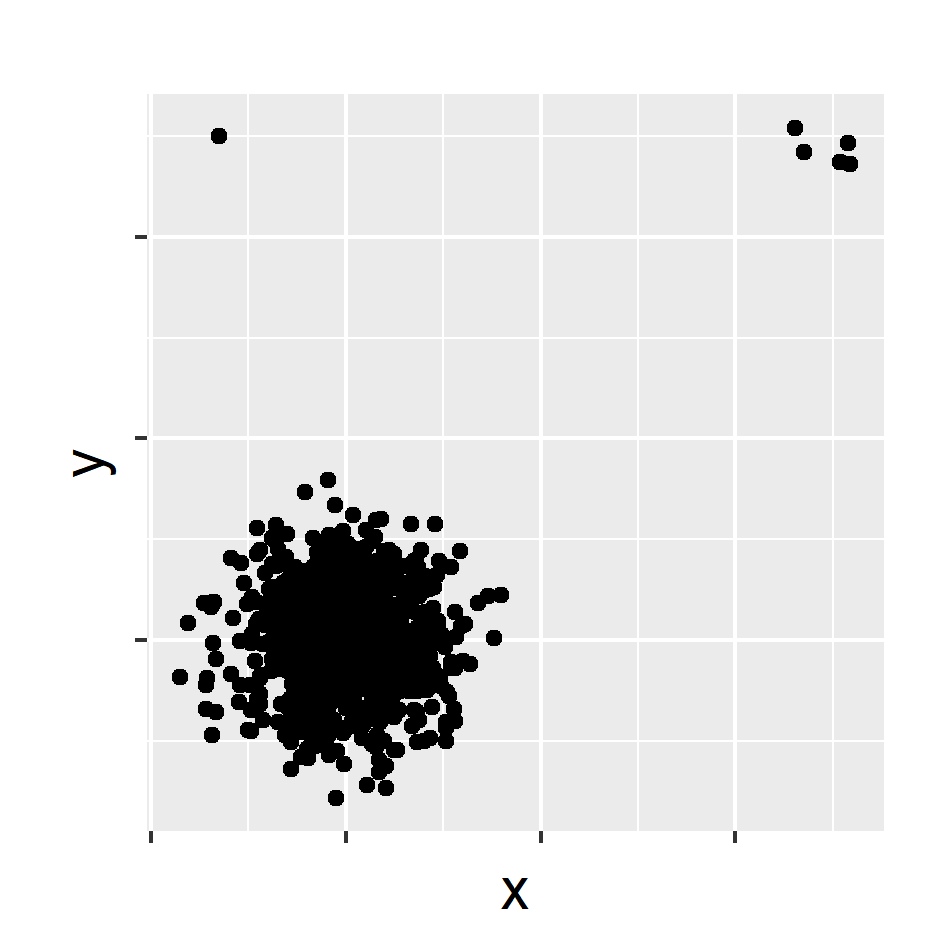
- Normalize the columns of the data. (median and IQR)
- This prevents variables with large variances having disproportional influence on Euclidean distances.
Why not "nearest neighbour" distances?
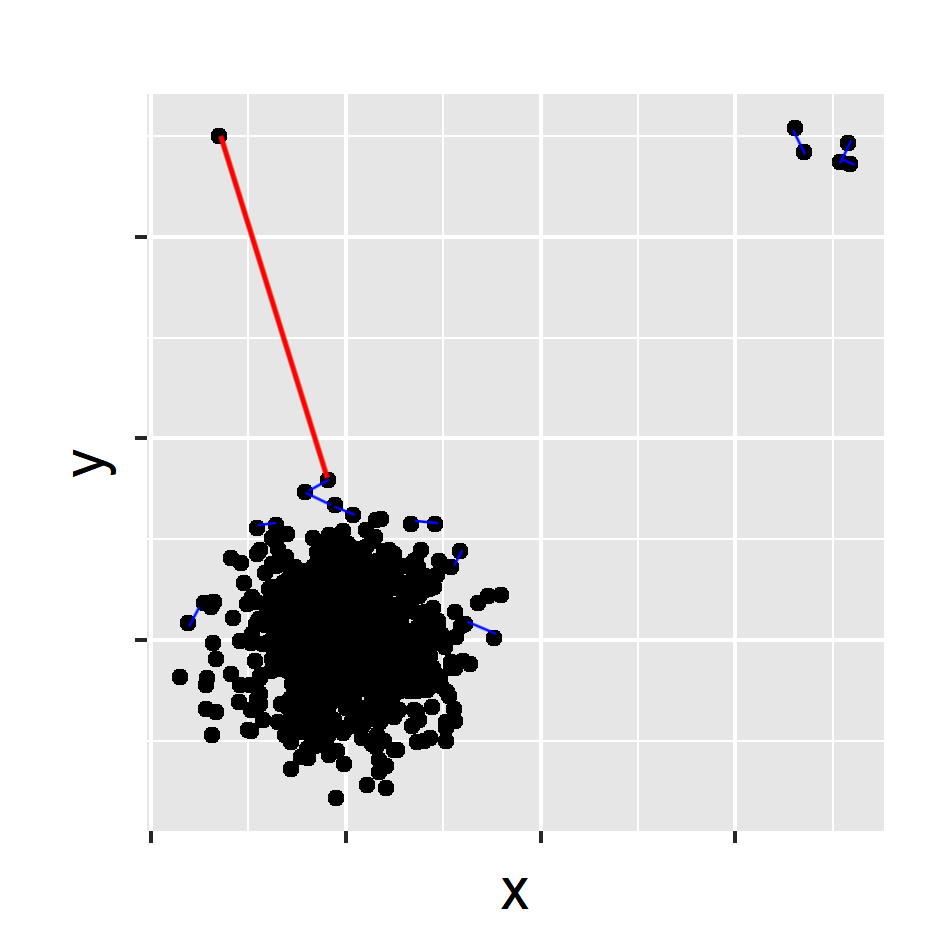
- Calculate the nearest neighbour distance
stray
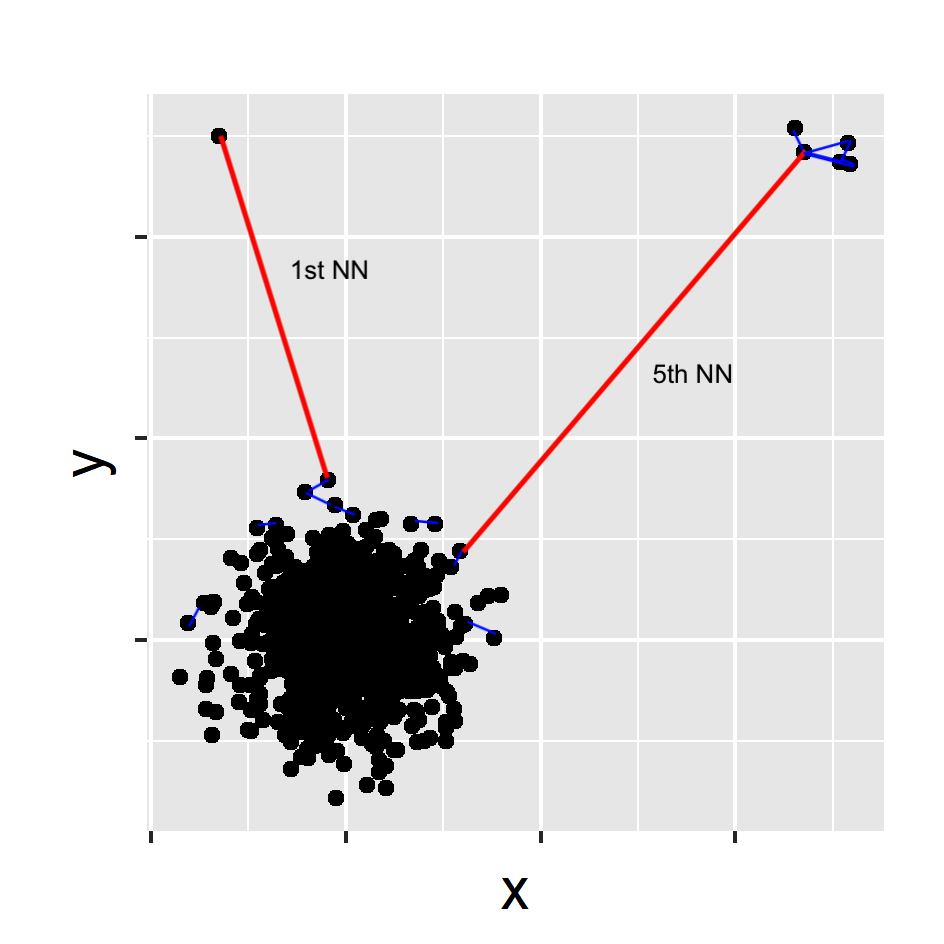
- Select the k nearest neighbour distance with the maximum gap
Calculate anomalous threshold
- Use extreme value theory (EVT) to calculate a data driven outlier threshold.
Calculate anomalous threshold
Use extreme value theory (EVT) to calculate a data driven outlier threshold.
Let n be the size of the dataset
Calculate anomalous threshold
Use extreme value theory (EVT) to calculate a data driven outlier threshold.
Let n be the size of the dataset
Sort the resulting n outlier scores
Calculate anomalous threshold
Use extreme value theory (EVT) to calculate a data driven outlier threshold.
Let n be the size of the dataset
Sort the resulting n outlier scores
Consider the half of the outlier scores with the smallest values as typical
Calculate anomalous threshold
Use extreme value theory (EVT) to calculate a data driven outlier threshold.
Let n be the size of the dataset
Sort the resulting n outlier scores
Consider the half of the outlier scores with the smallest values as typical
Search for any significant large gap in the upper tail (Bottom up searching algorithm proposed by Schwarz, 2008)
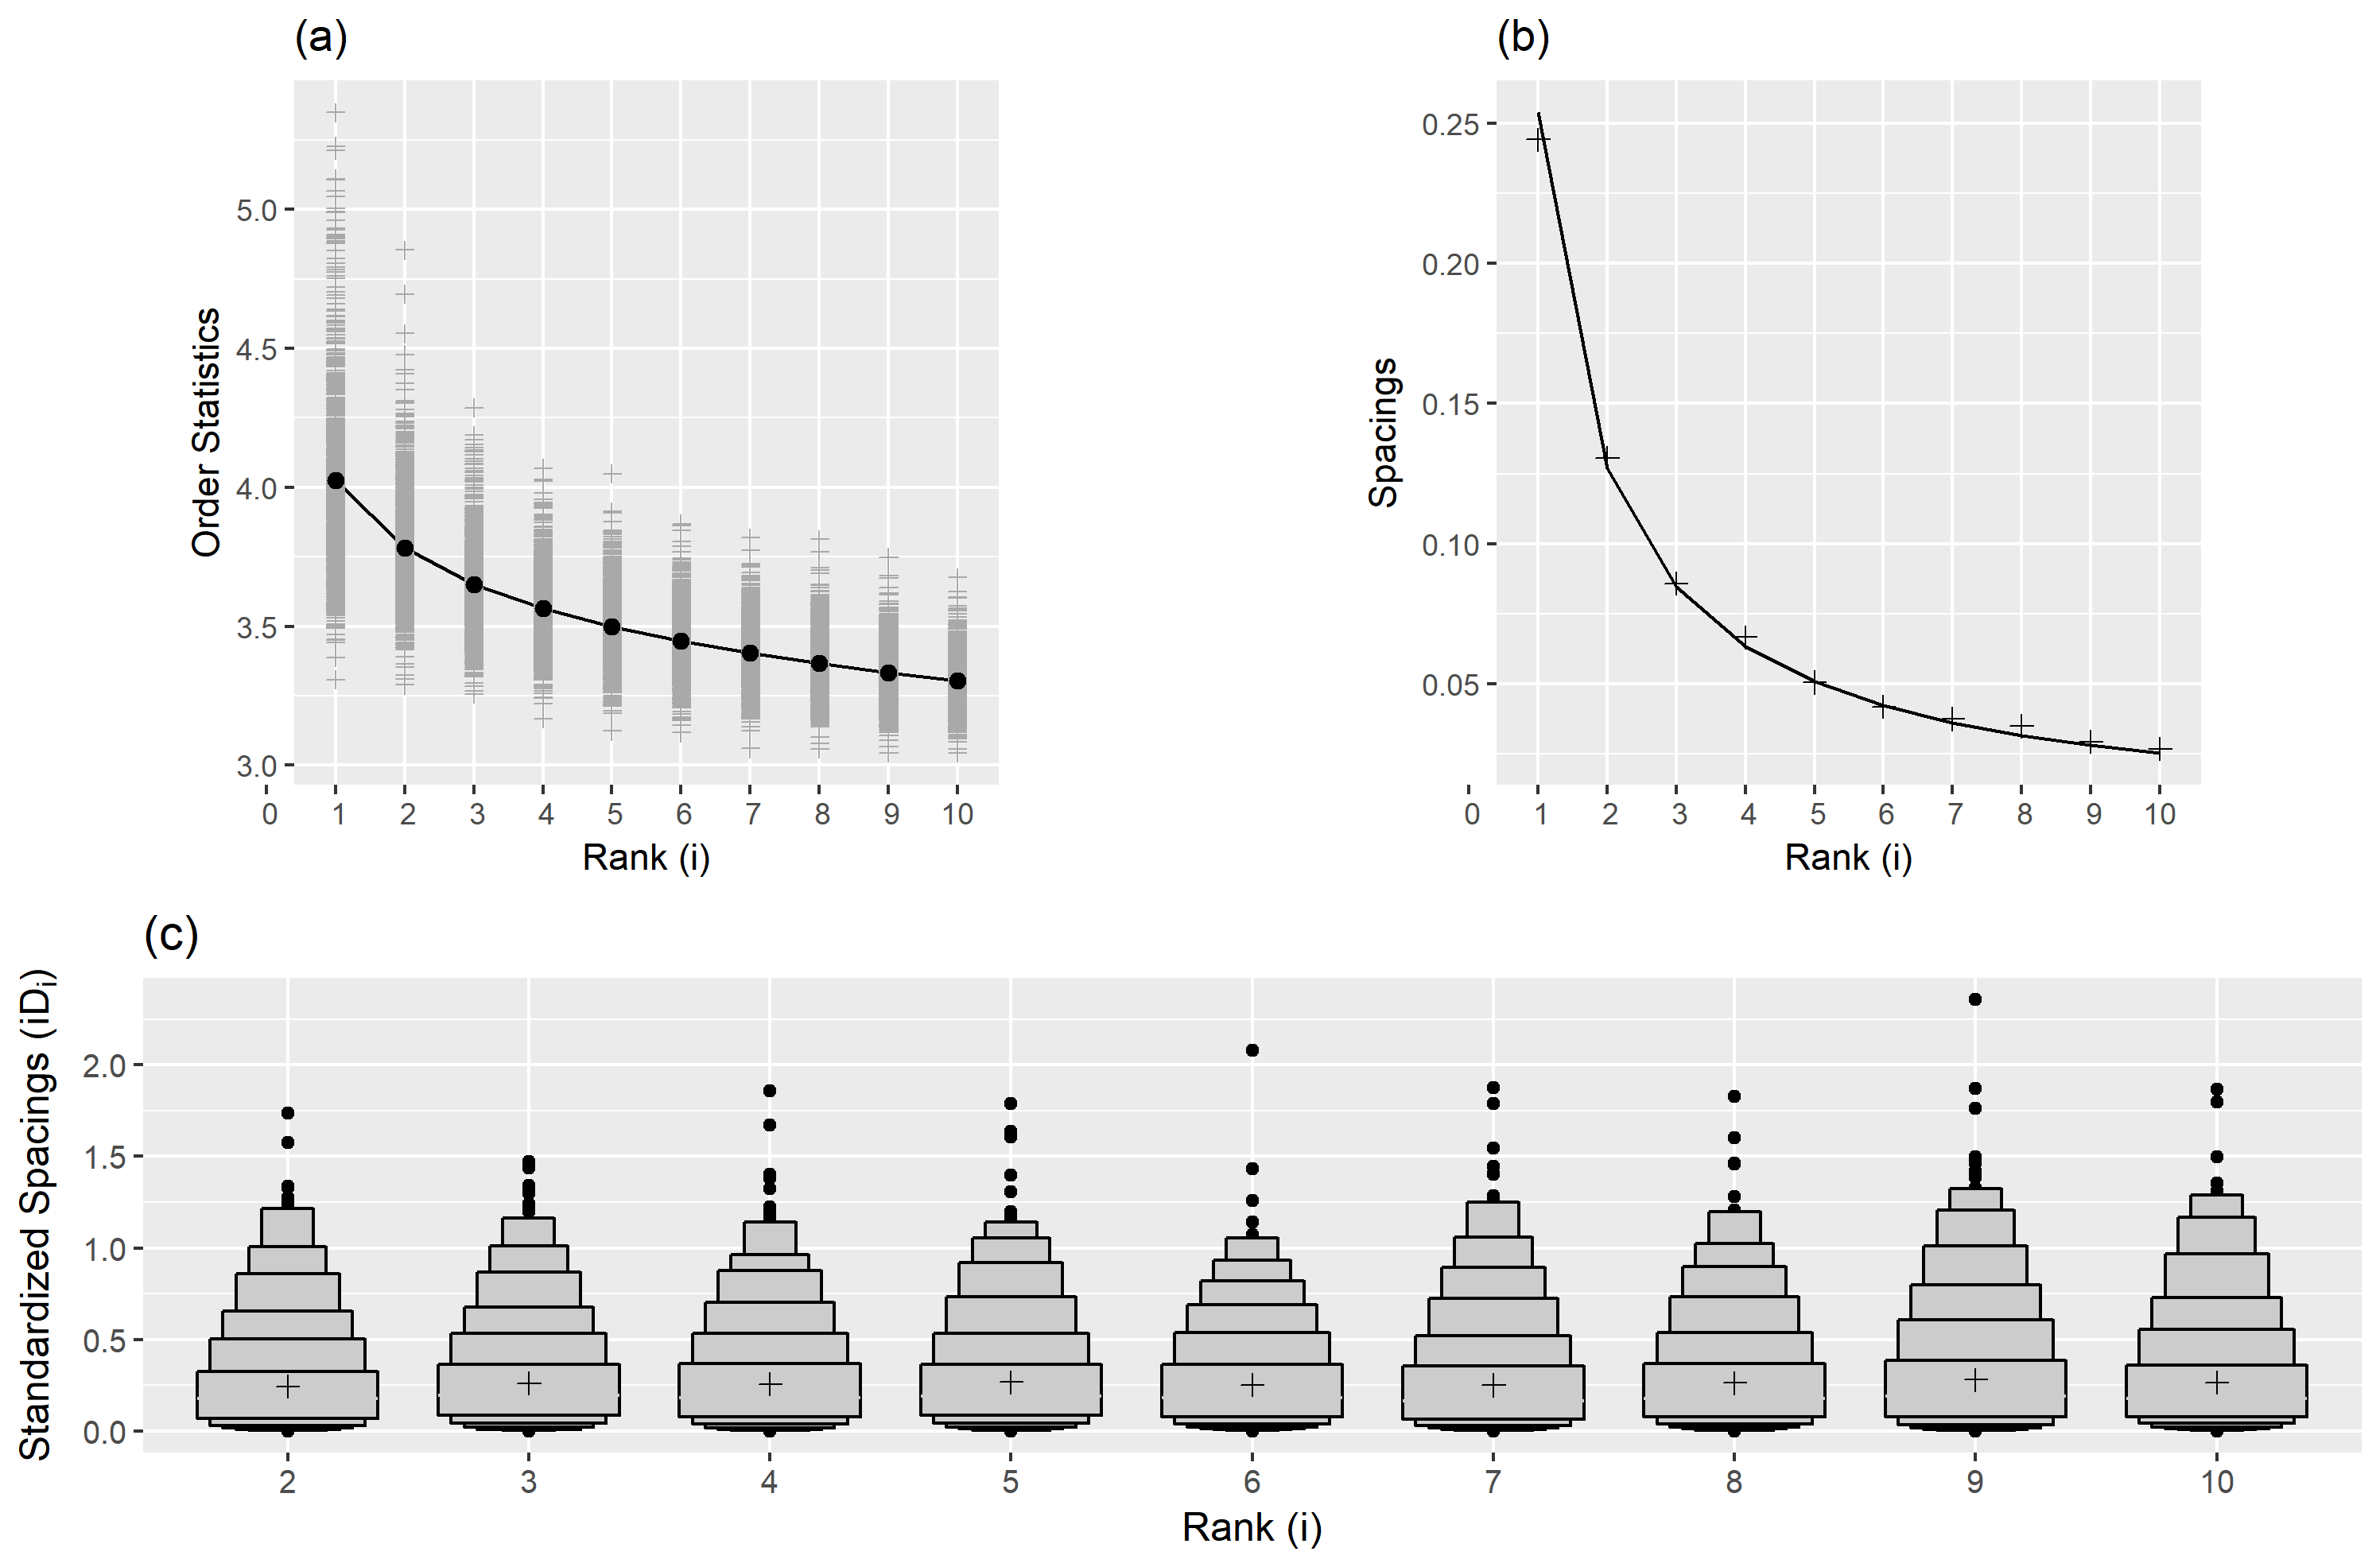
Spacing theorem (Weissman, 1978)
Let X1,X2,...,Xn be a sample from a distribution function F .
Let X1:n≥X2:n≥...≥Xn:n be the order statistics.
The available data are X1:n,X2:n,...,Xk:n for some fixed k.
Let Di,n=Xi:n−Xi+1:n, (i=1,2,...,k) be the spacing between successive order statistics.
If F is in the maximum domain of attraction of the Gumbel distribution, then the spacings Di,n are asymptotically independent and exponentially distributed with mean proportional to i−1.
stray
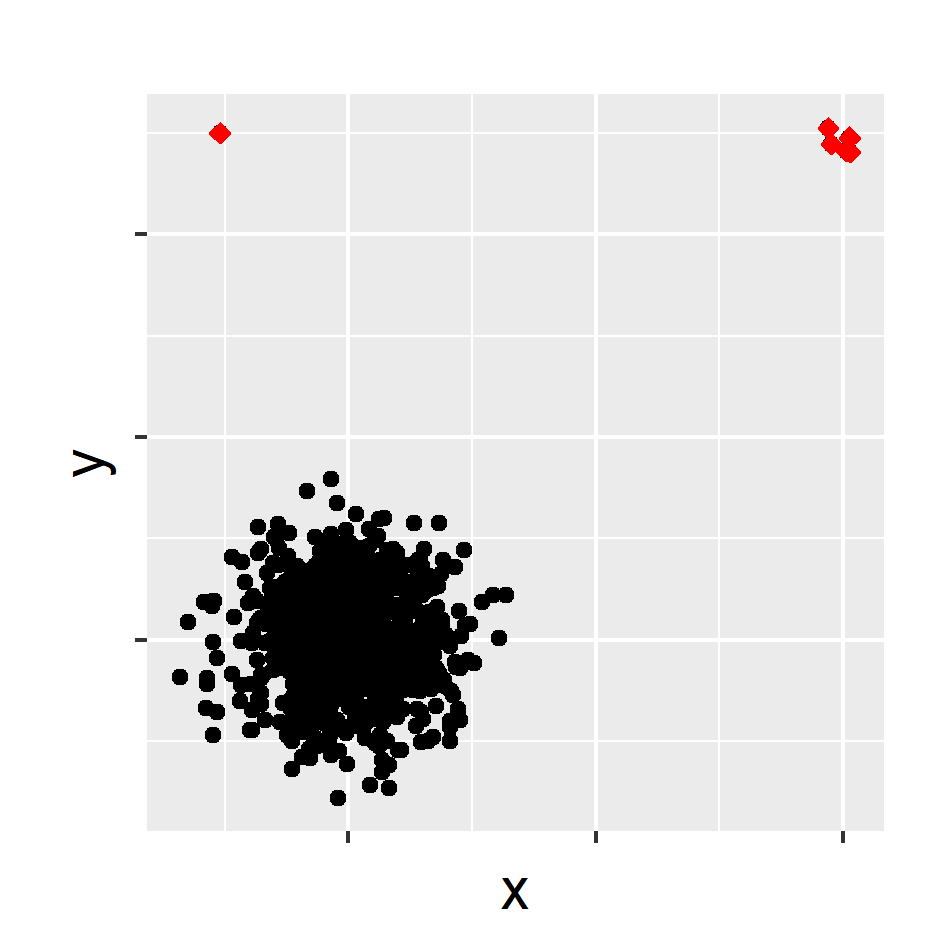
outliers <- find_HDoutliers(data)
display_HDoutliers(data, outliers)
Advantages of the proposed algorithm
- Detect clusters of outlying points
Advantages of the proposed algorithm
Detect clusters of outlying points
Applied to both uni- and multi- dimensional data
Advantages of the proposed algorithm
Detect clusters of outlying points
Applied to both uni- and multi- dimensional data
Handle large datasets due to the use of approximate KNN searching algorithm
Advantages of the proposed algorithm
Detect clusters of outlying points
Applied to both uni- and multi- dimensional data
Handle large datasets due to the use of approximate KNN searching algorithm
Does not require a training set to build the decision model
Advantages of the proposed algorithm
Detect clusters of outlying points
Applied to both uni- and multi- dimensional data
Handle large datasets due to the use of approximate KNN searching algorithm
Does not require a training set to build the decision model
Deal with multimodal typical classes
Advantages of the proposed algorithm
Detect clusters of outlying points
Applied to both uni- and multi- dimensional data
Handle large datasets due to the use of approximate KNN searching algorithm
Does not require a training set to build the decision model
Deal with multimodal typical classes
Outlier threshold has a probabilistic interpretation
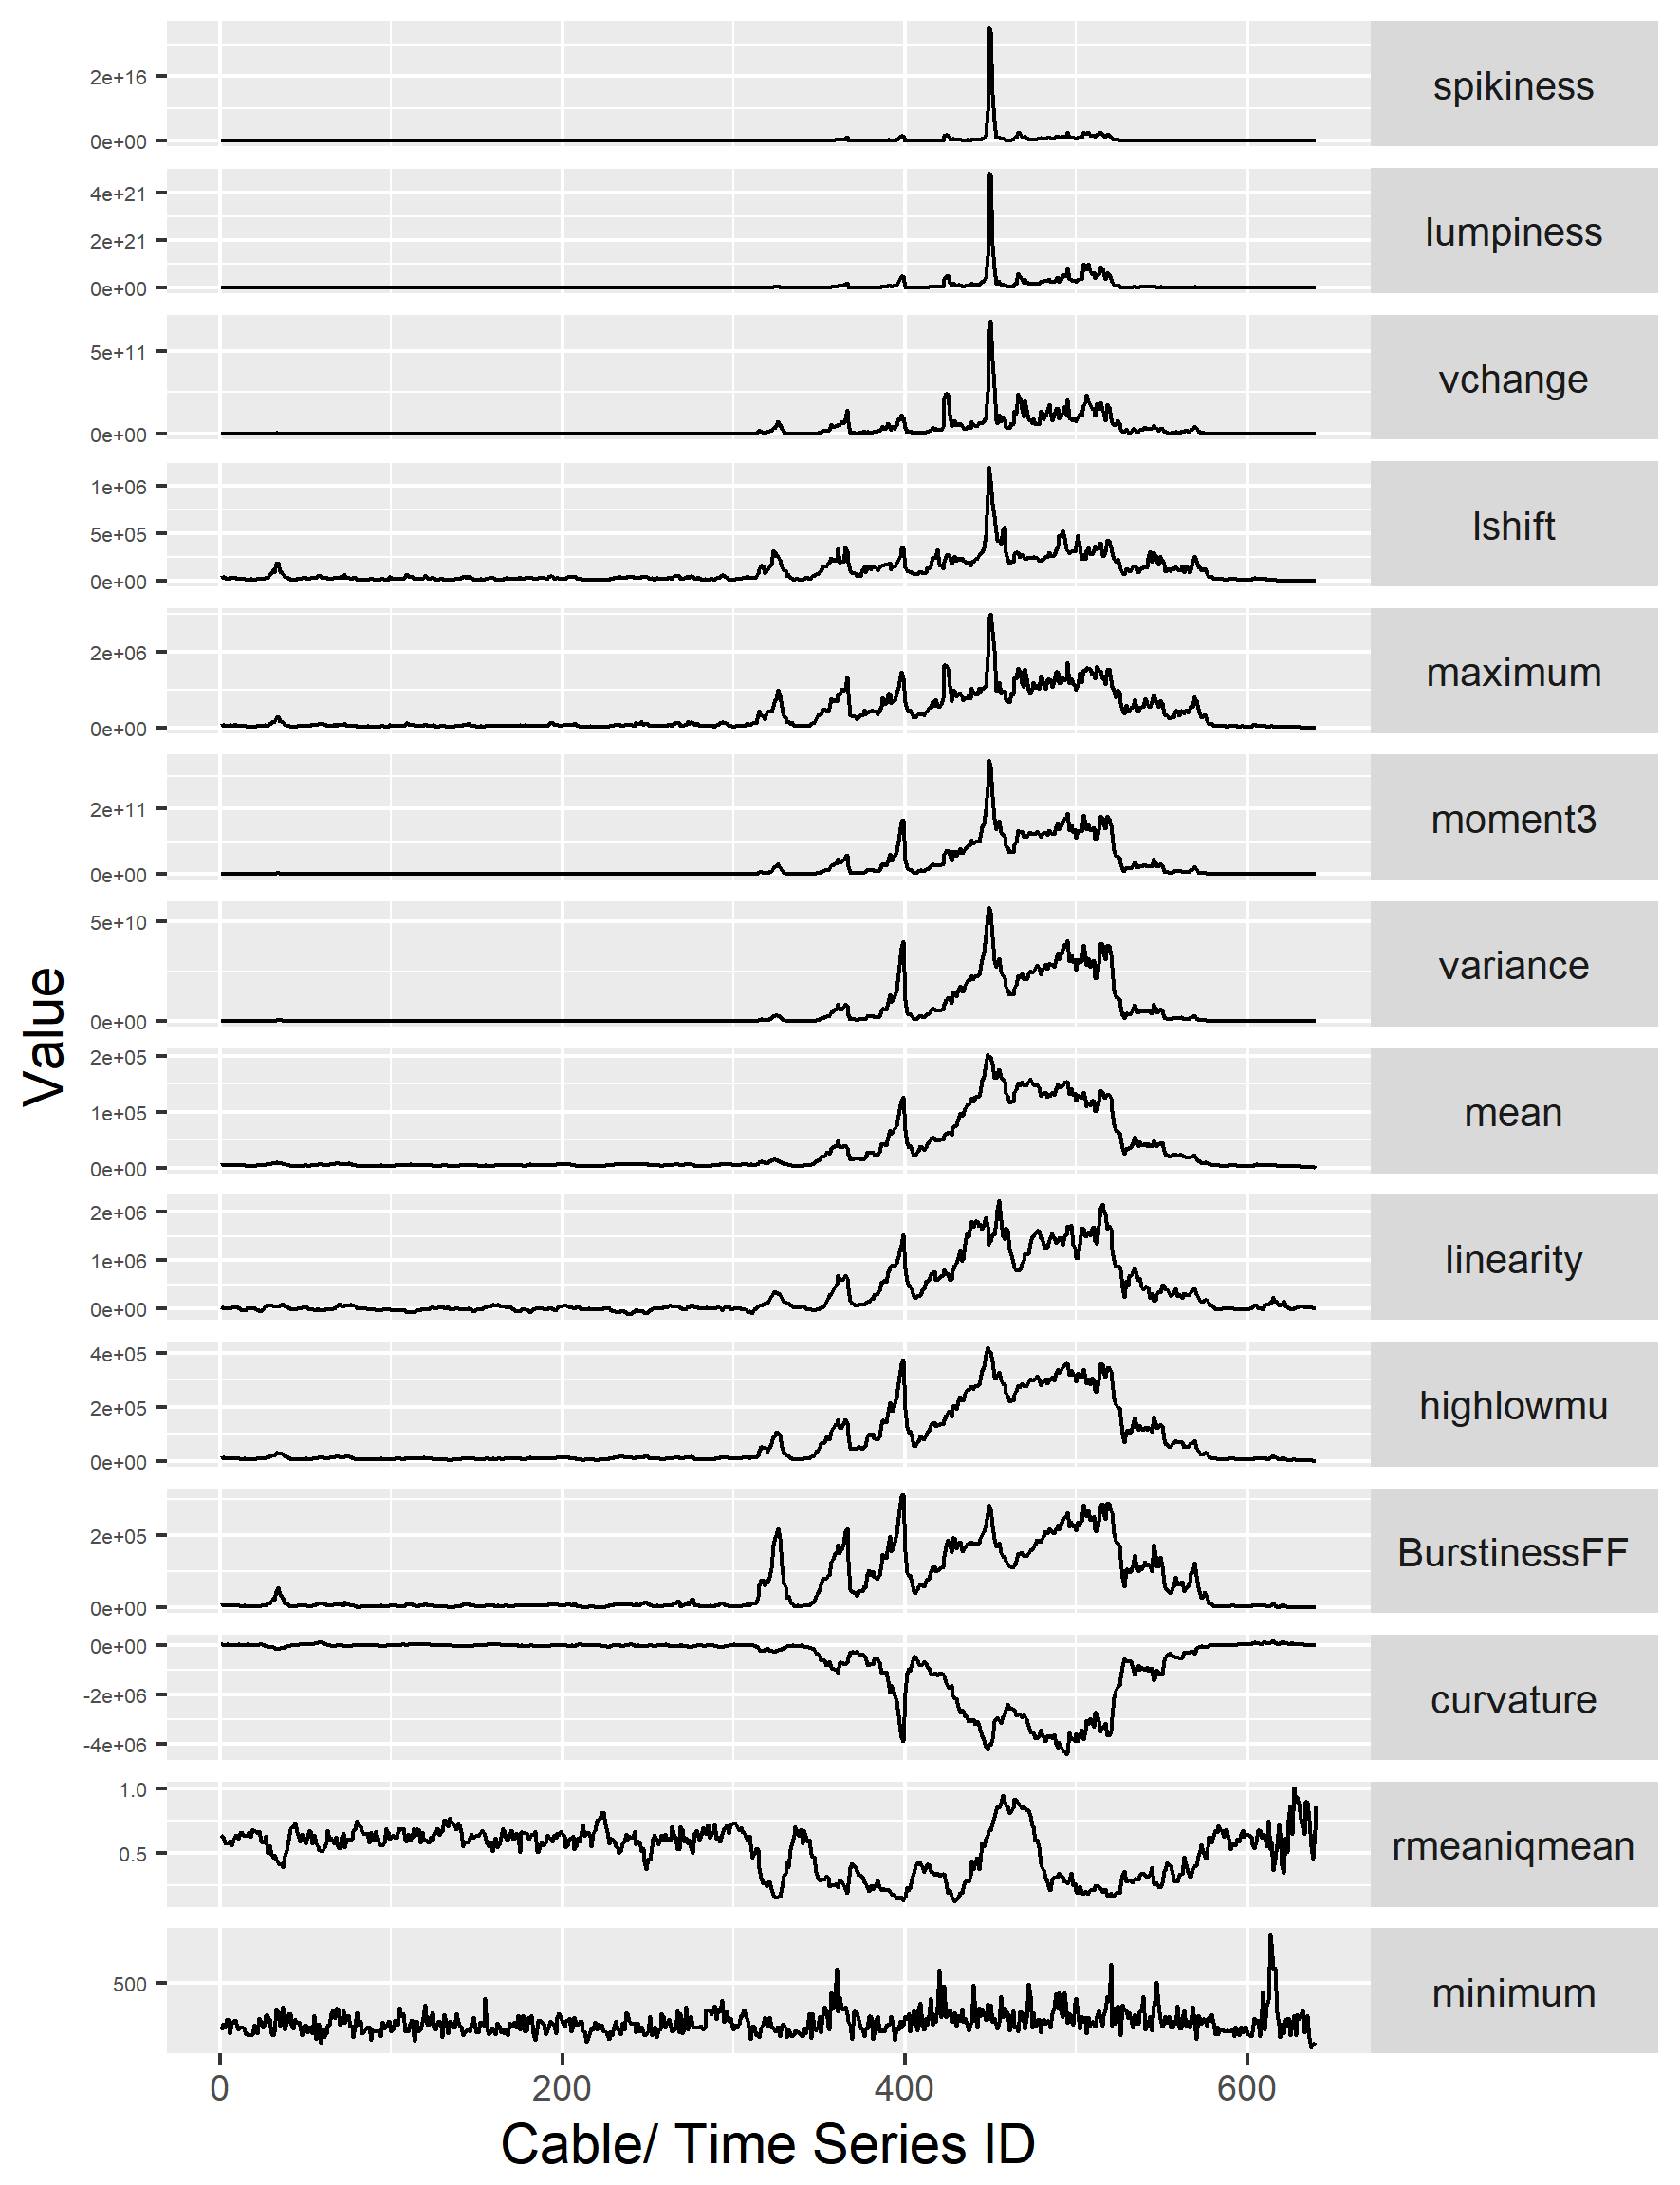
Feature based representation of time series
Mean
Variance
Changing variance in remainder
Level shift using rolling window
Variance change
Strength of linearity
Strength of curvature
Strength of spikiness
Burstiness of time series (Fano Factor)
Minimum
Maximum
The ratio between 50% trimmed mean and the arithmetic mean
Moment
Ratio of means of data that is below and above the global mean
Approach 1: Using stray
- Use a moving window to deal with streaming data
- Extract time series features from window
- Apply stray algorithm to identify anomalous series
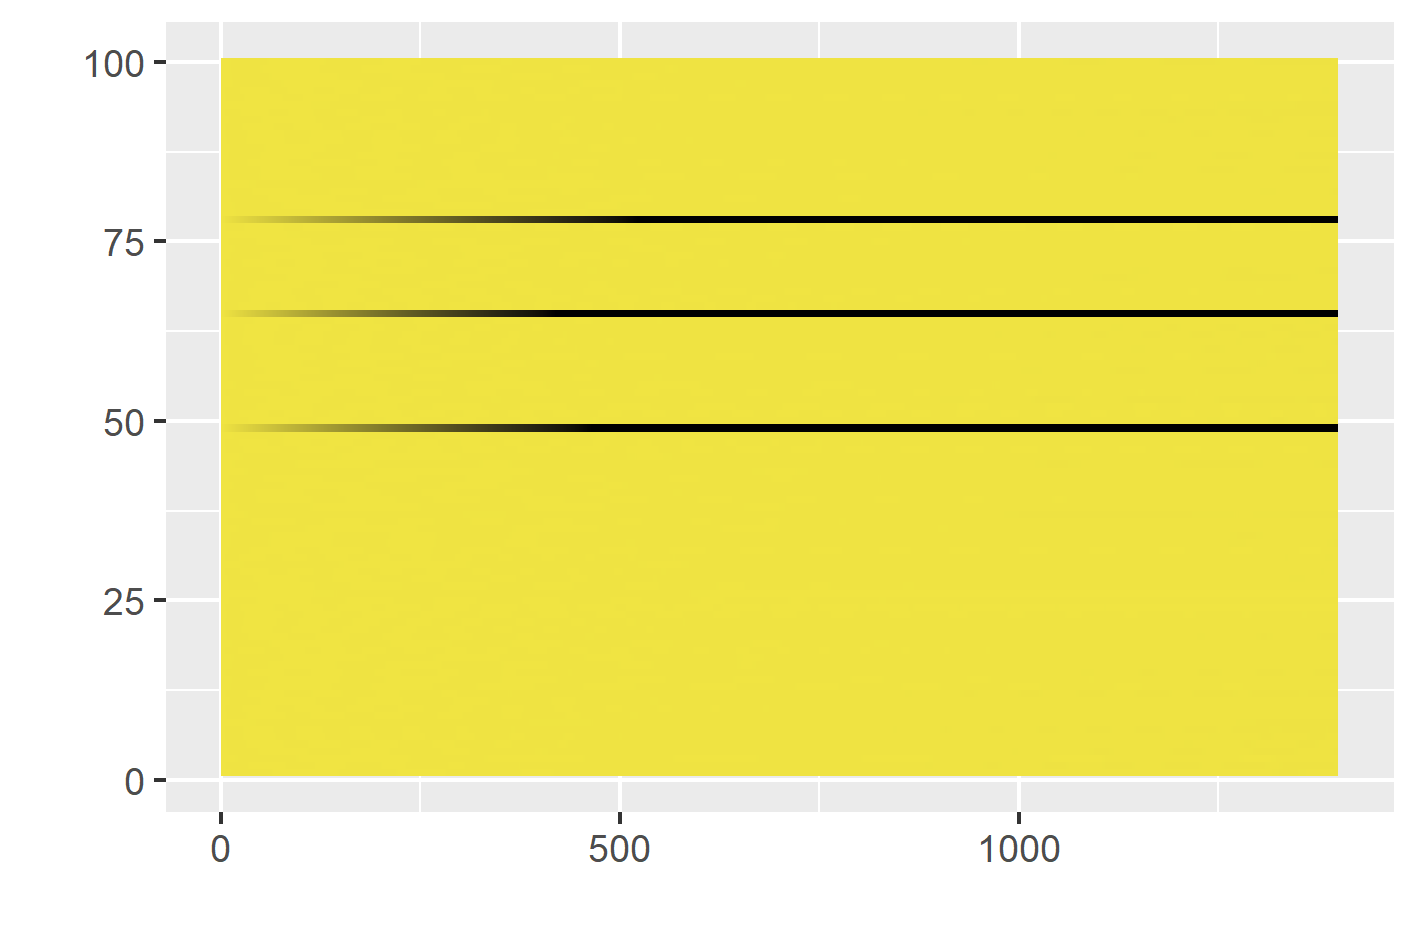
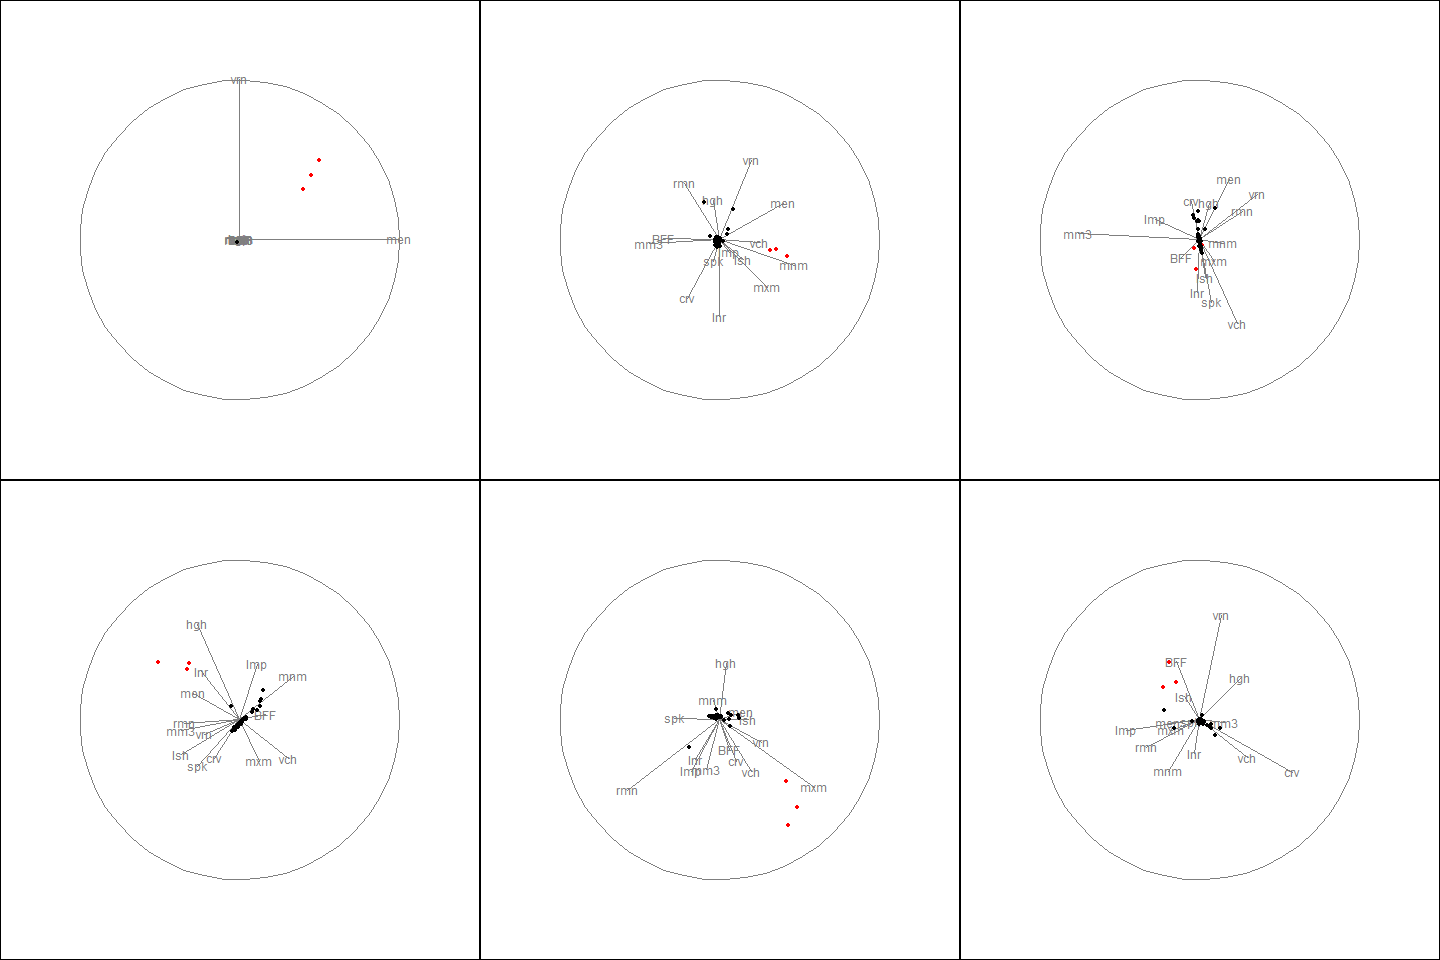
tsfeatures <- oddstream::extract_tsfeatures(ts_data)
outliers <- stray::find_HDoutliers(tsfeatures)
stray::display_HDoutliers(tsfeatures, outliers)
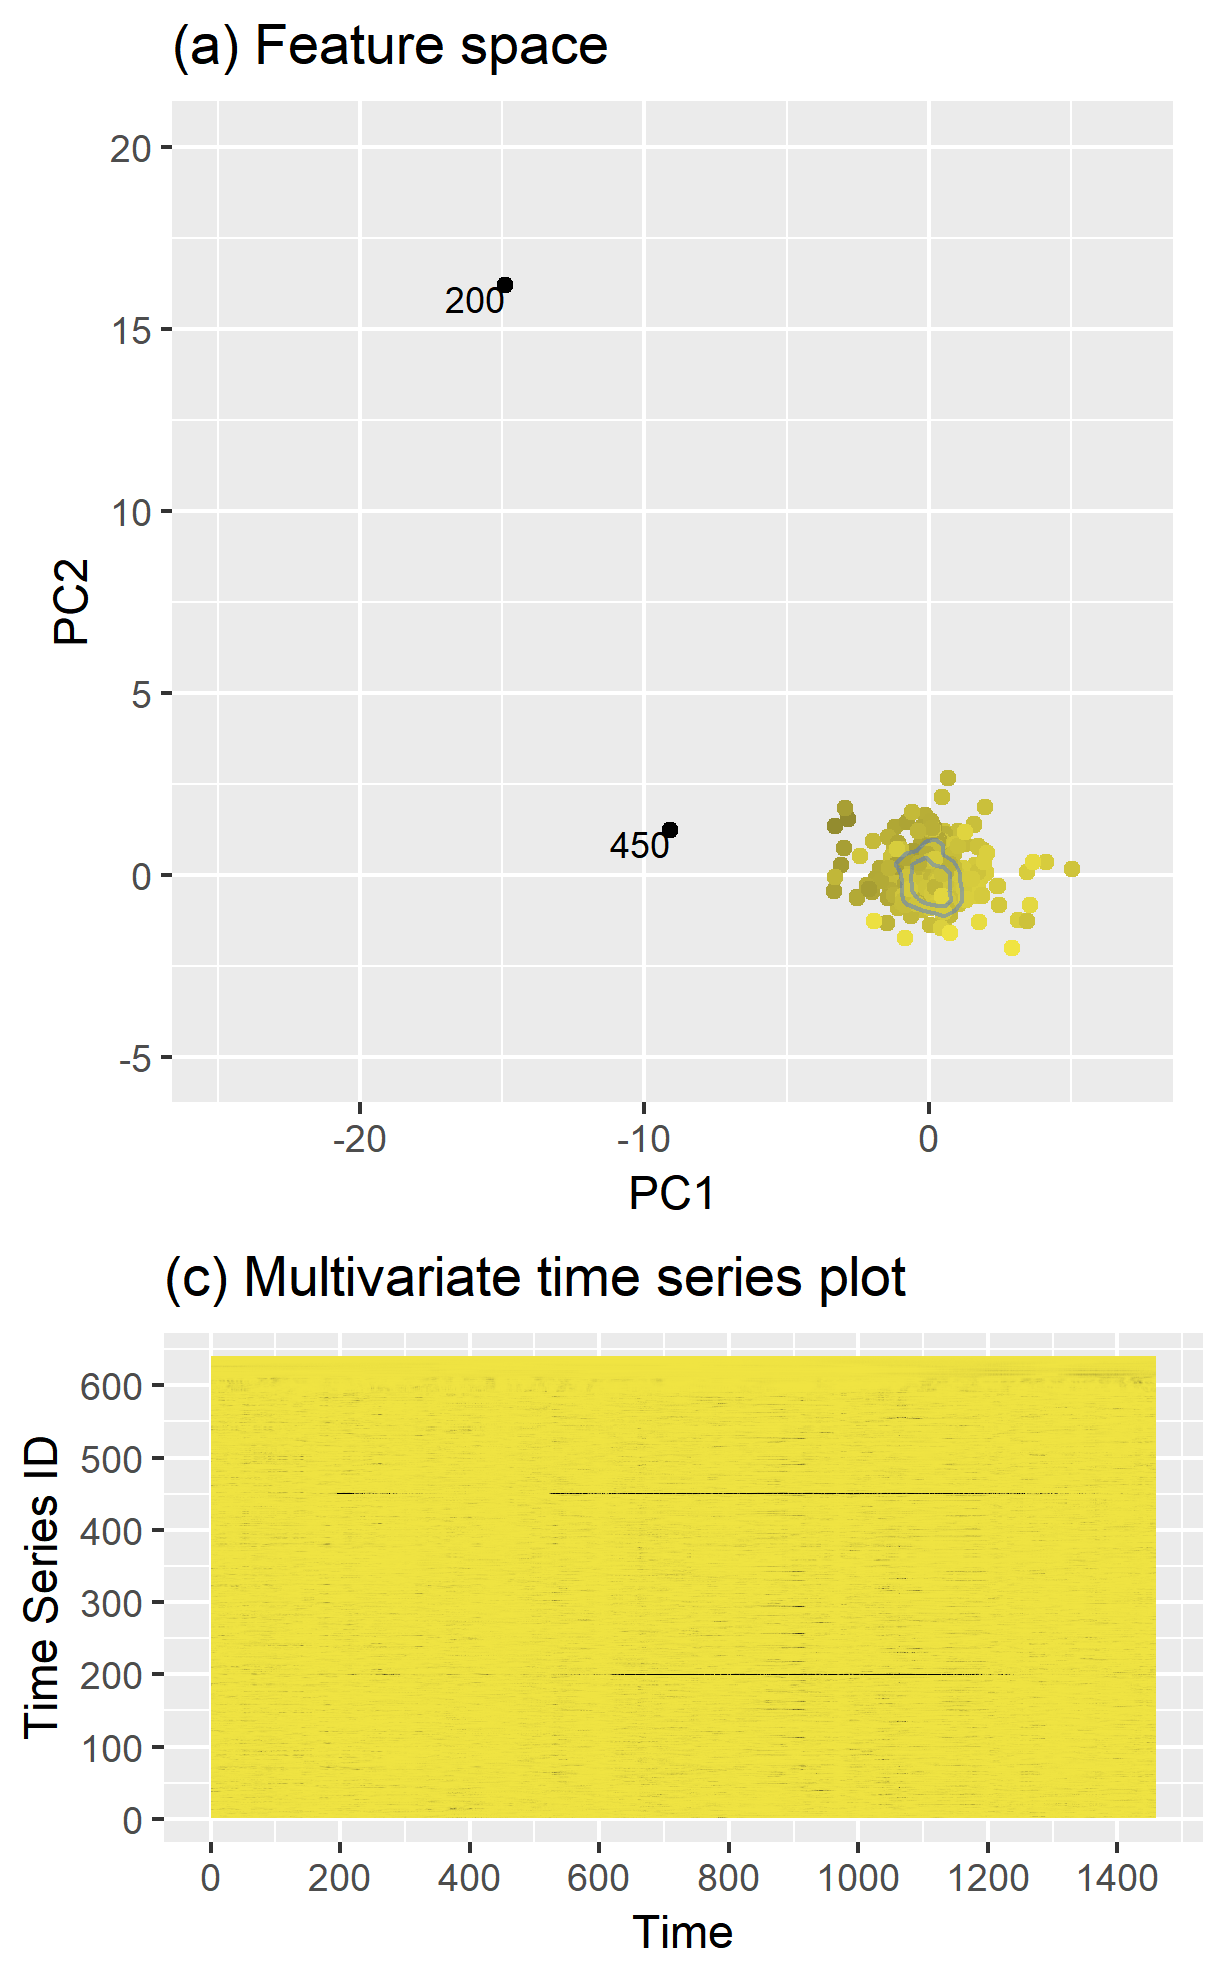

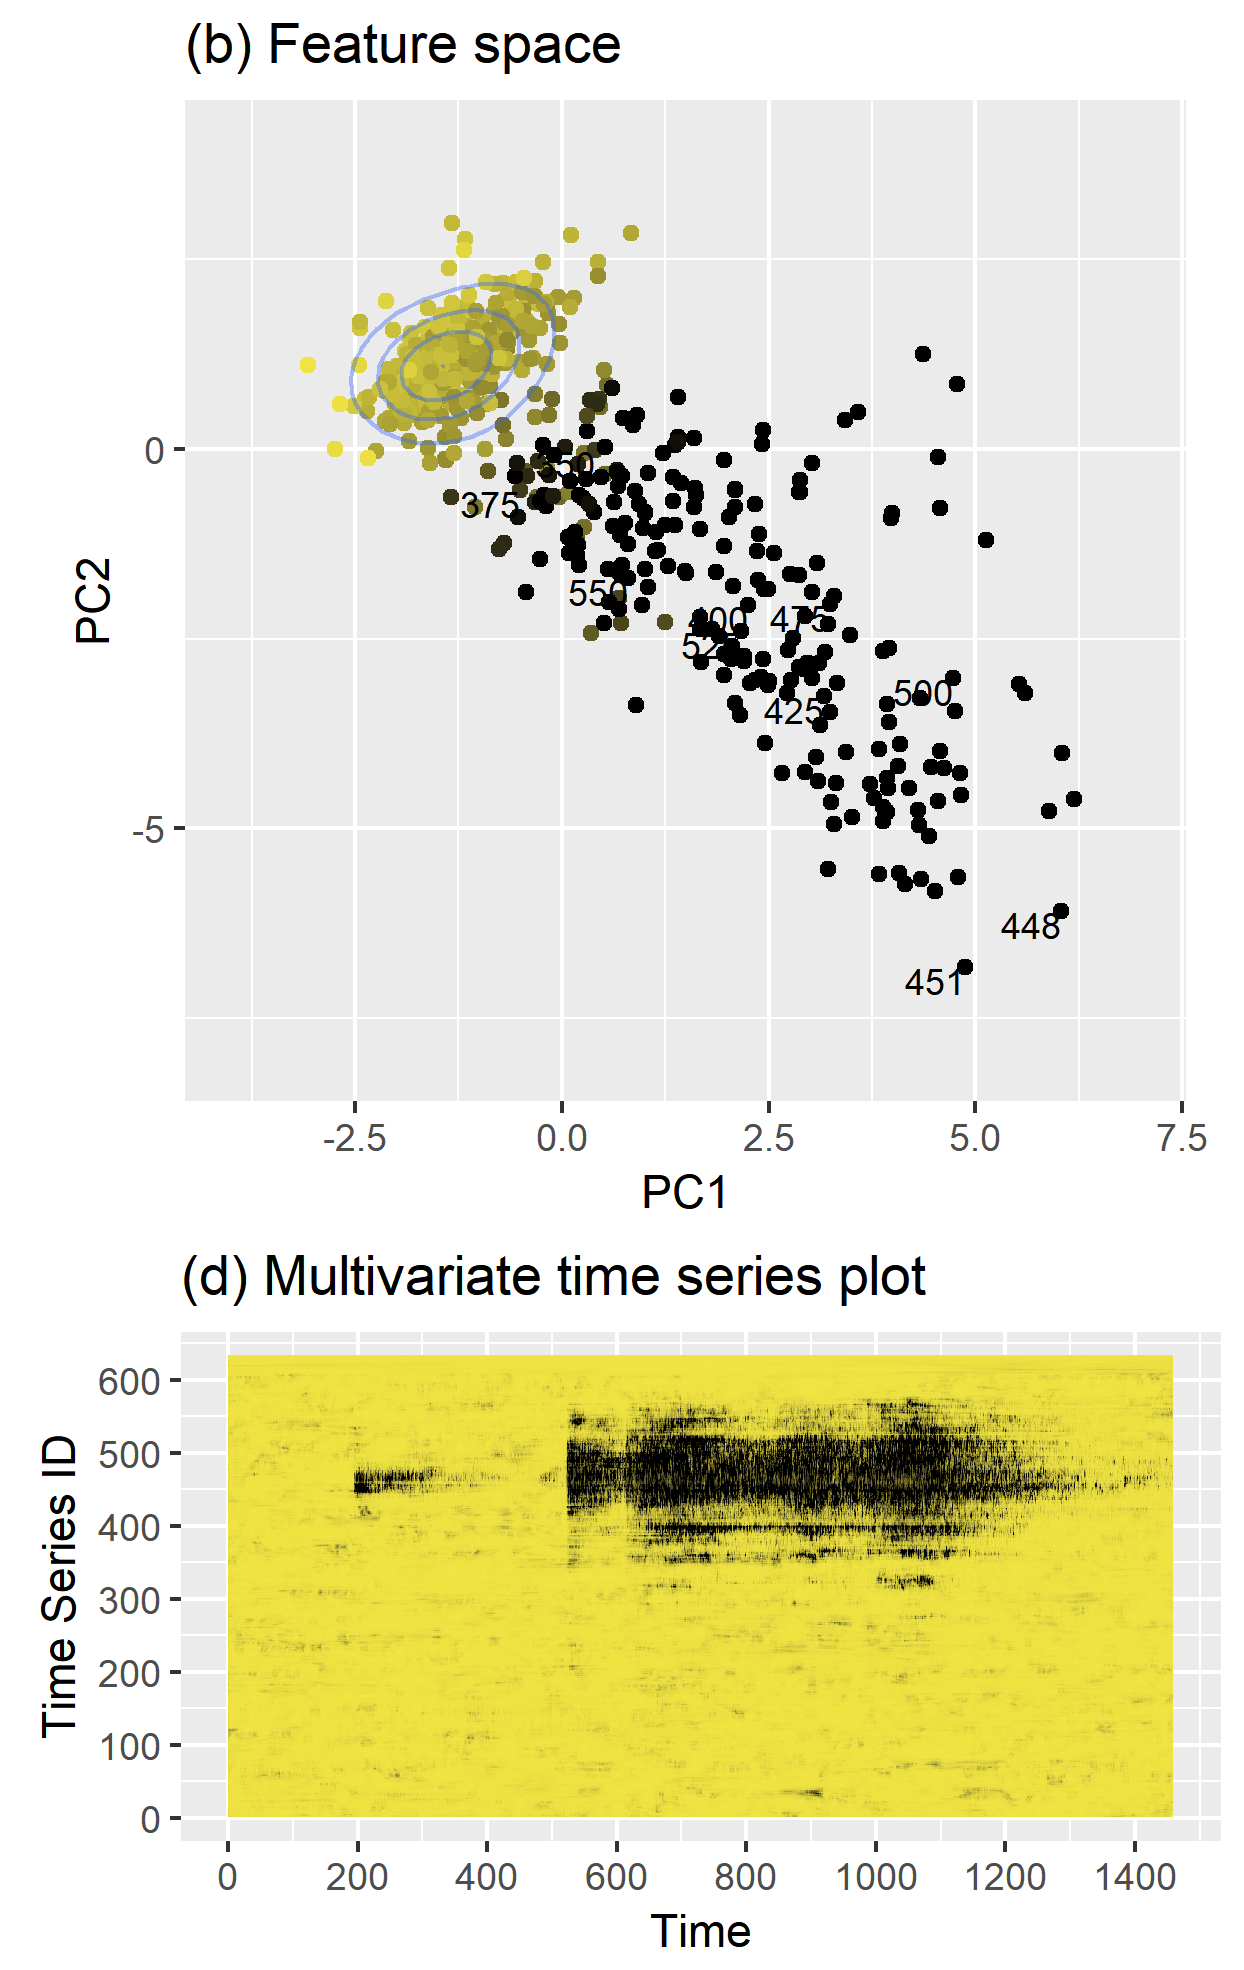
oddstream
(Outlier Detection in Data STREAMs)

devtools::install_github("pridiltal/oddstream")
How oddstream works
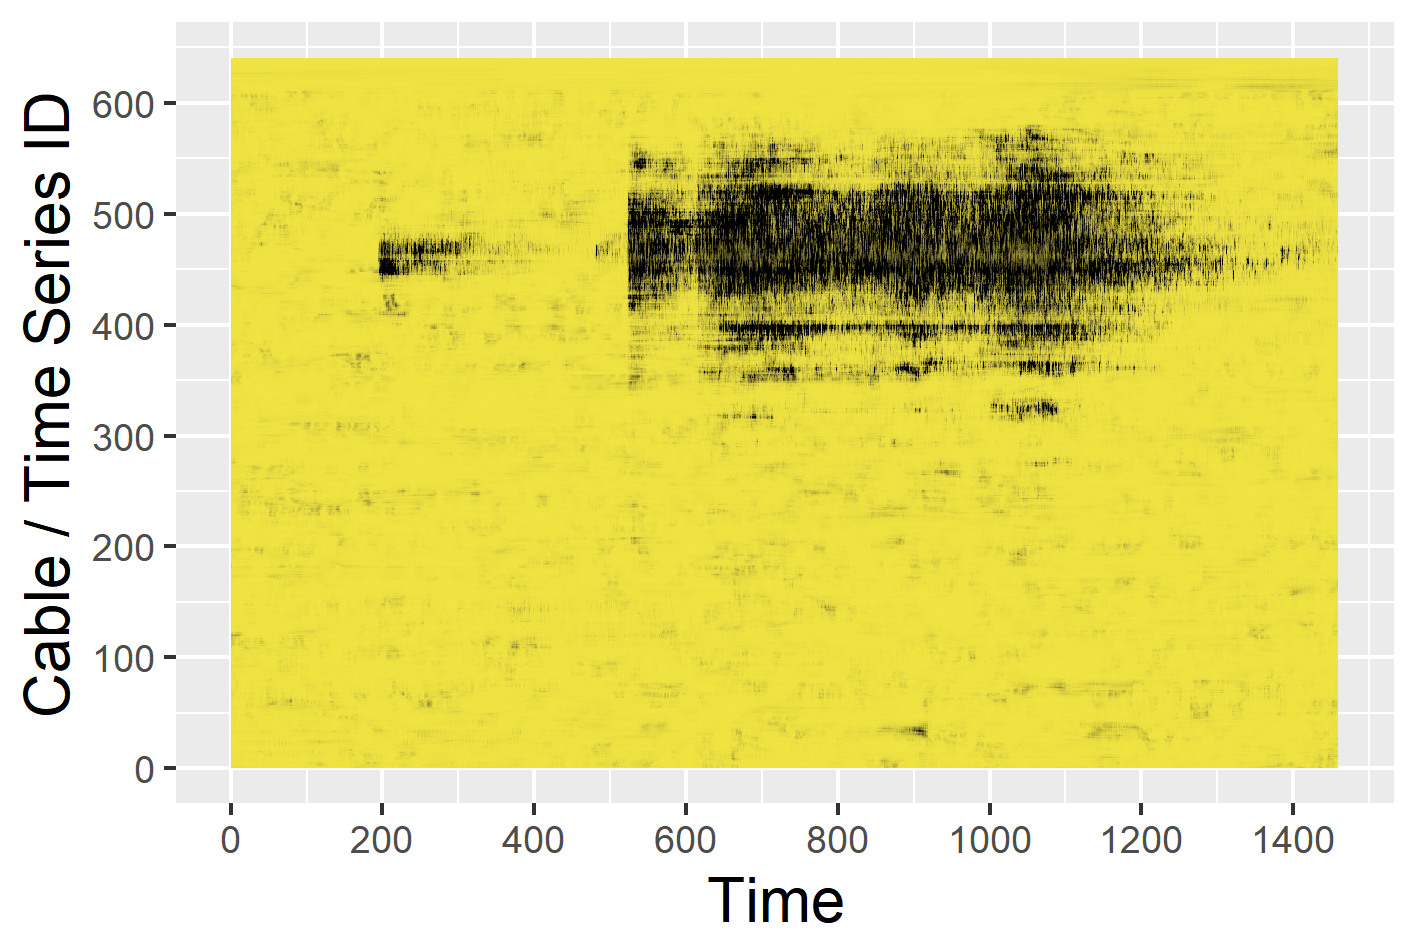
How oddstream works
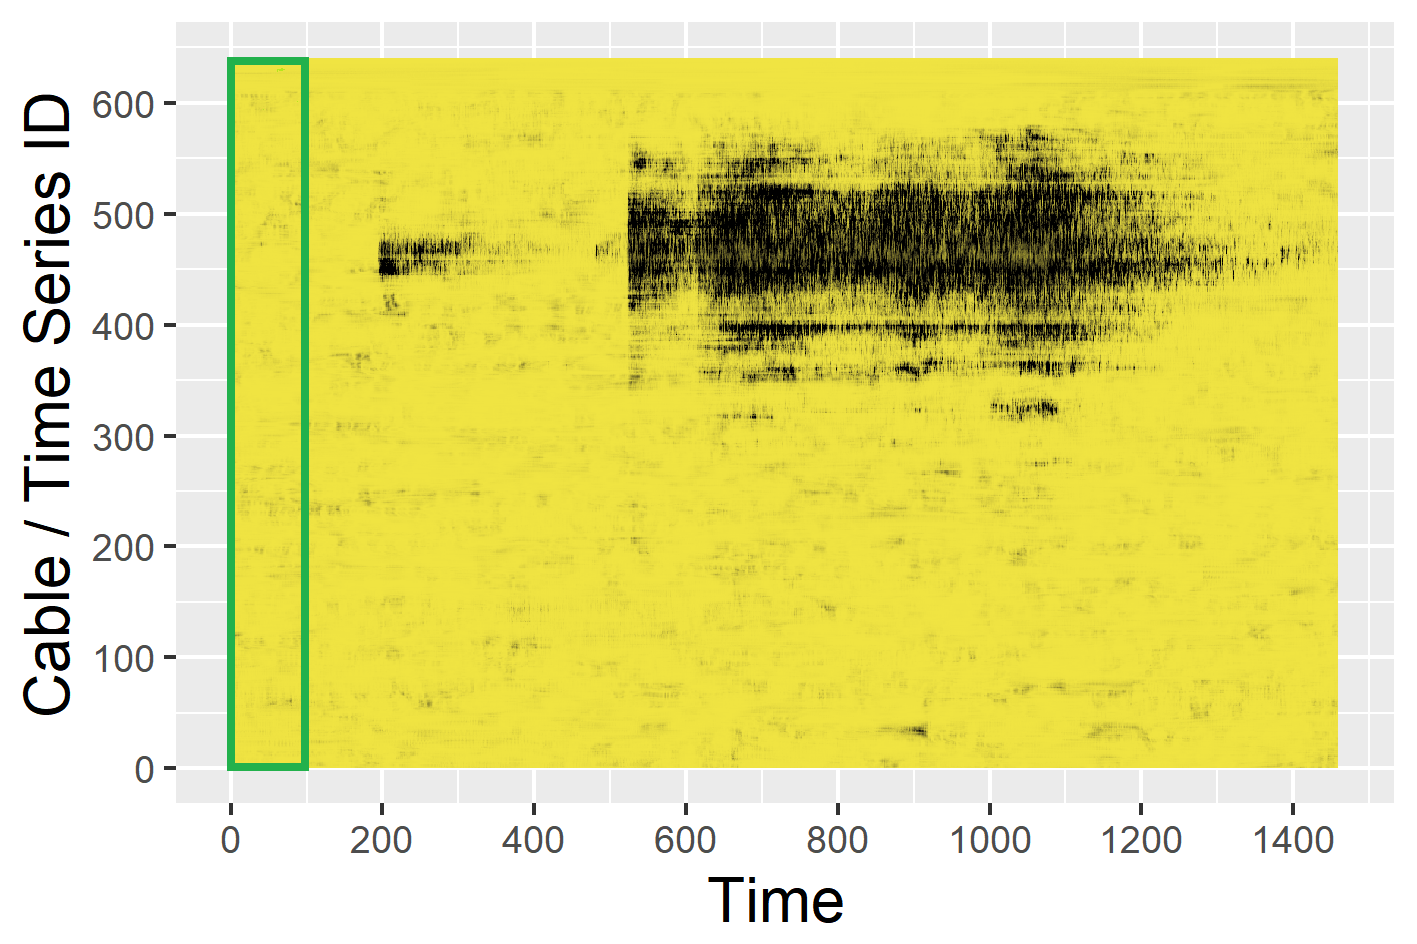
Dimension reduction for time series
load(train_data)
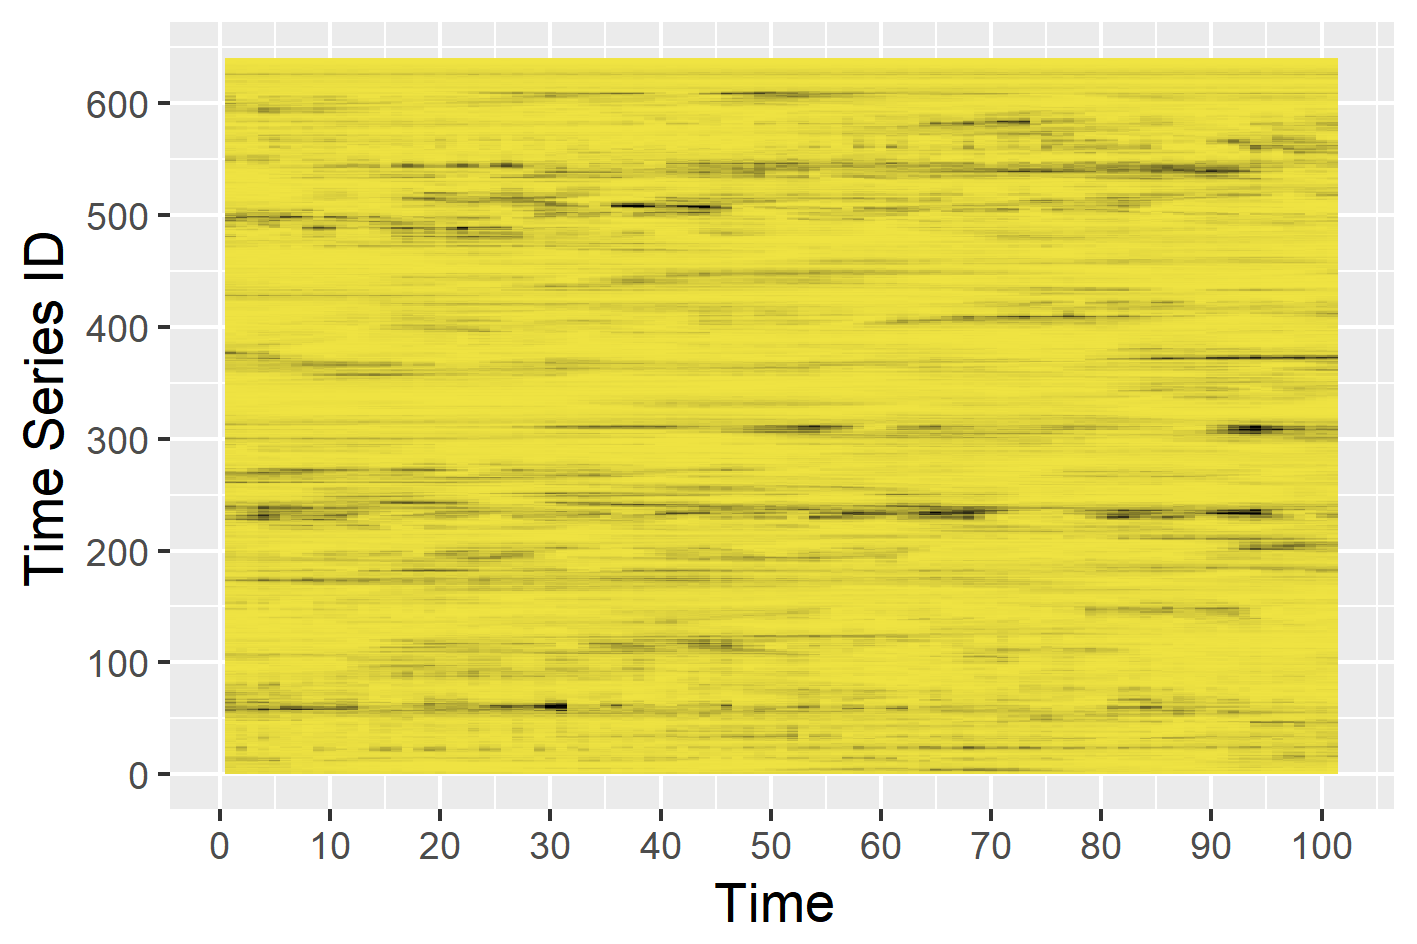
Dimension reduction for time series
load(train_data)

tsfeatures <- oddstream::extract_tsfeatures(train_data)
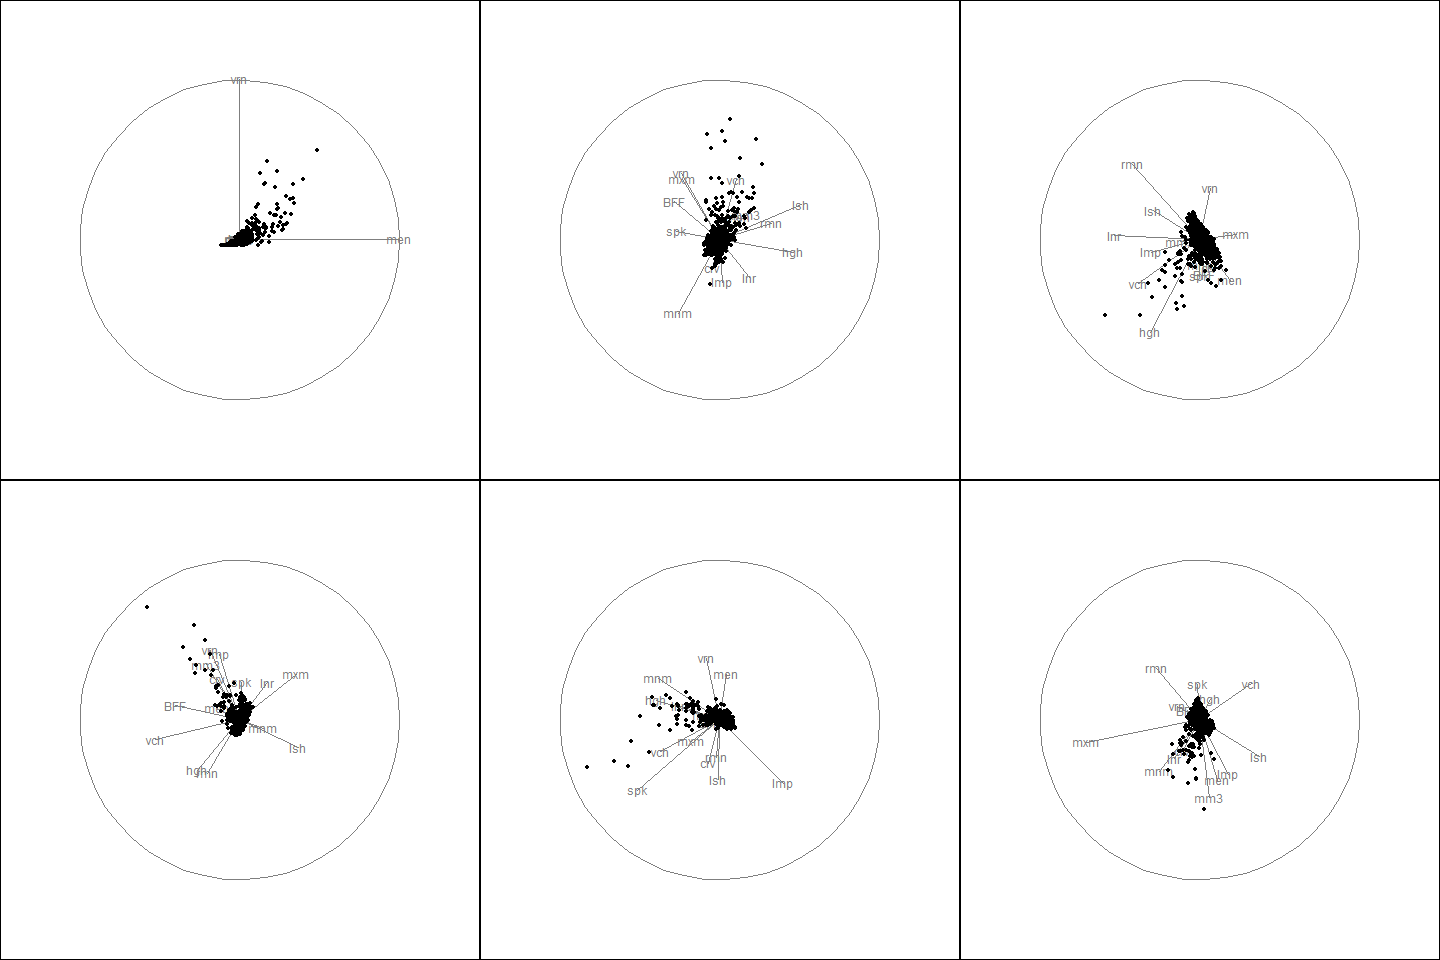
tsfeatures <- oddstream::extract_tsfeatures(train_data)

tsfeatures <- oddstream::extract_tsfeatures(train_data)

pc<- oddstream::get_pc_space(tsfeatures)
oddstream::plotpc(pc$pcnorm)
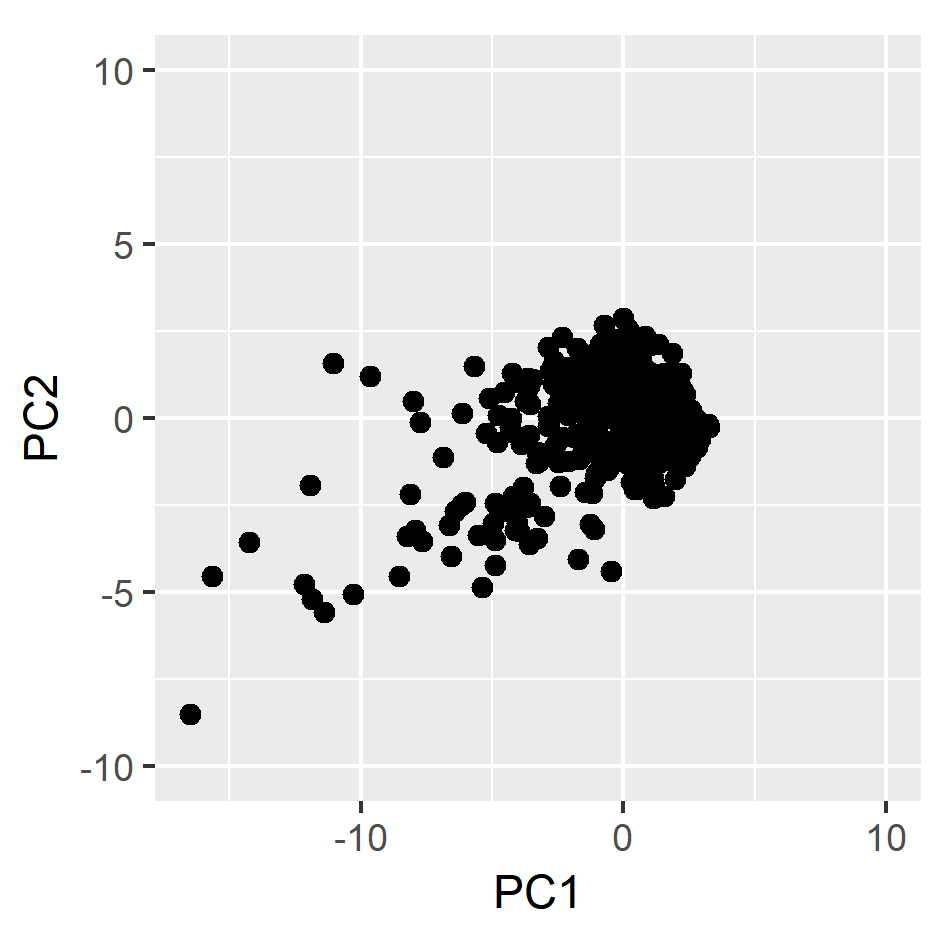
Anomalous threshold calculation
- Estimate the probability density function of the 2D PC space ⟶ Kernel density estimation
Anomalous threshold calculation
- Estimate the probability density function of the 2D PC space ⟶ Kernel density estimation
- Draw a large number N of extremes (argminx∈X[f2(x)]) from the estimated probability density function
Anomalous threshold calculation
- Estimate the probability density function of the 2D PC space ⟶ Kernel density estimation
- Draw a large number N of extremes (argminx∈X[f2(x)]) from the estimated probability density function
- Define a Ψ-transform space, using the Ψ-transformation defined by (Clifton et al., 2011)

- Ψ-transform maps the density values back into space into which a Gumbel distribution can be fitted.
Anomalous threshold calculation
- Estimate the probability density function of the 2D PC space ⟶ Kernel density estimation
- Draw a large number N of extremes (argminx∈X[f2(x)]) from the estimated probability density function
- Define a Ψ-transform space, using the Ψ-transformation defined by (Clifton et al., 2011)

- Ψ-transform maps the density values back into space into which a Gumbel distribution can be fitted.
- Anomalous threshold calculation ⟶ extreme value theory
oddstream::find_odd_streams(train_data, test_stream)
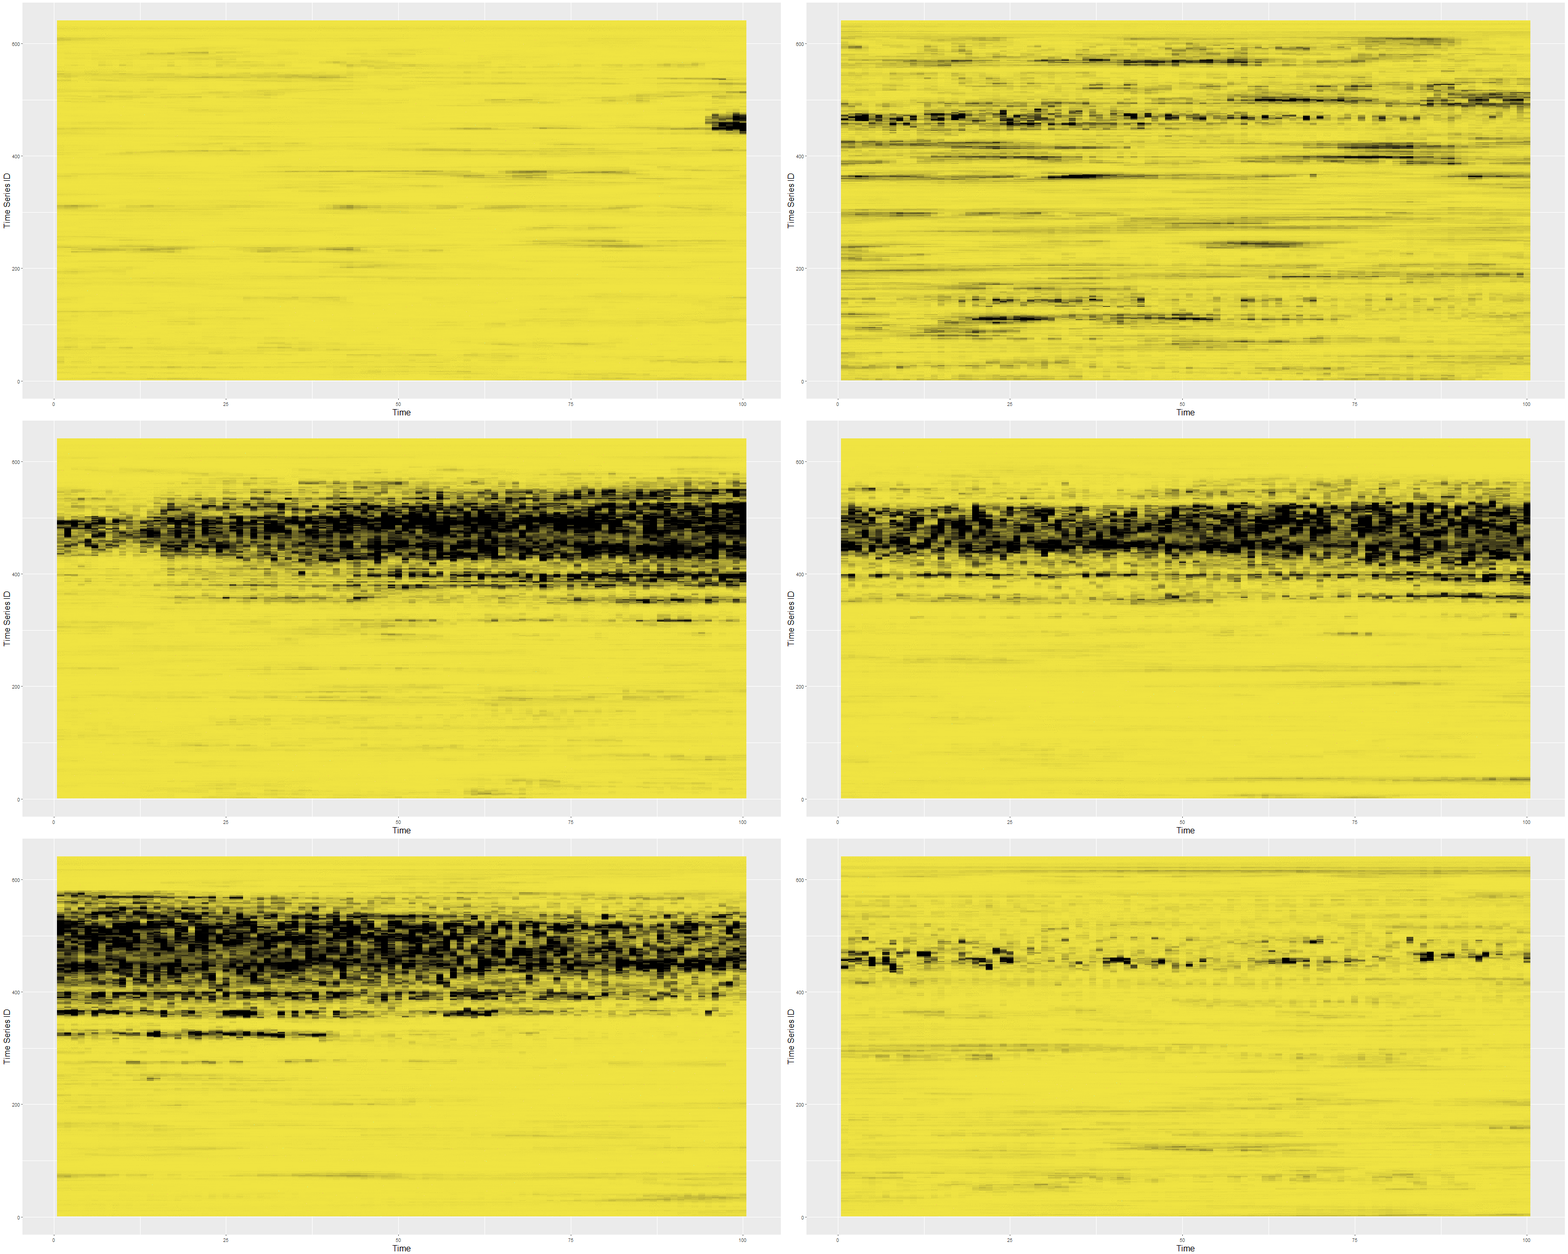
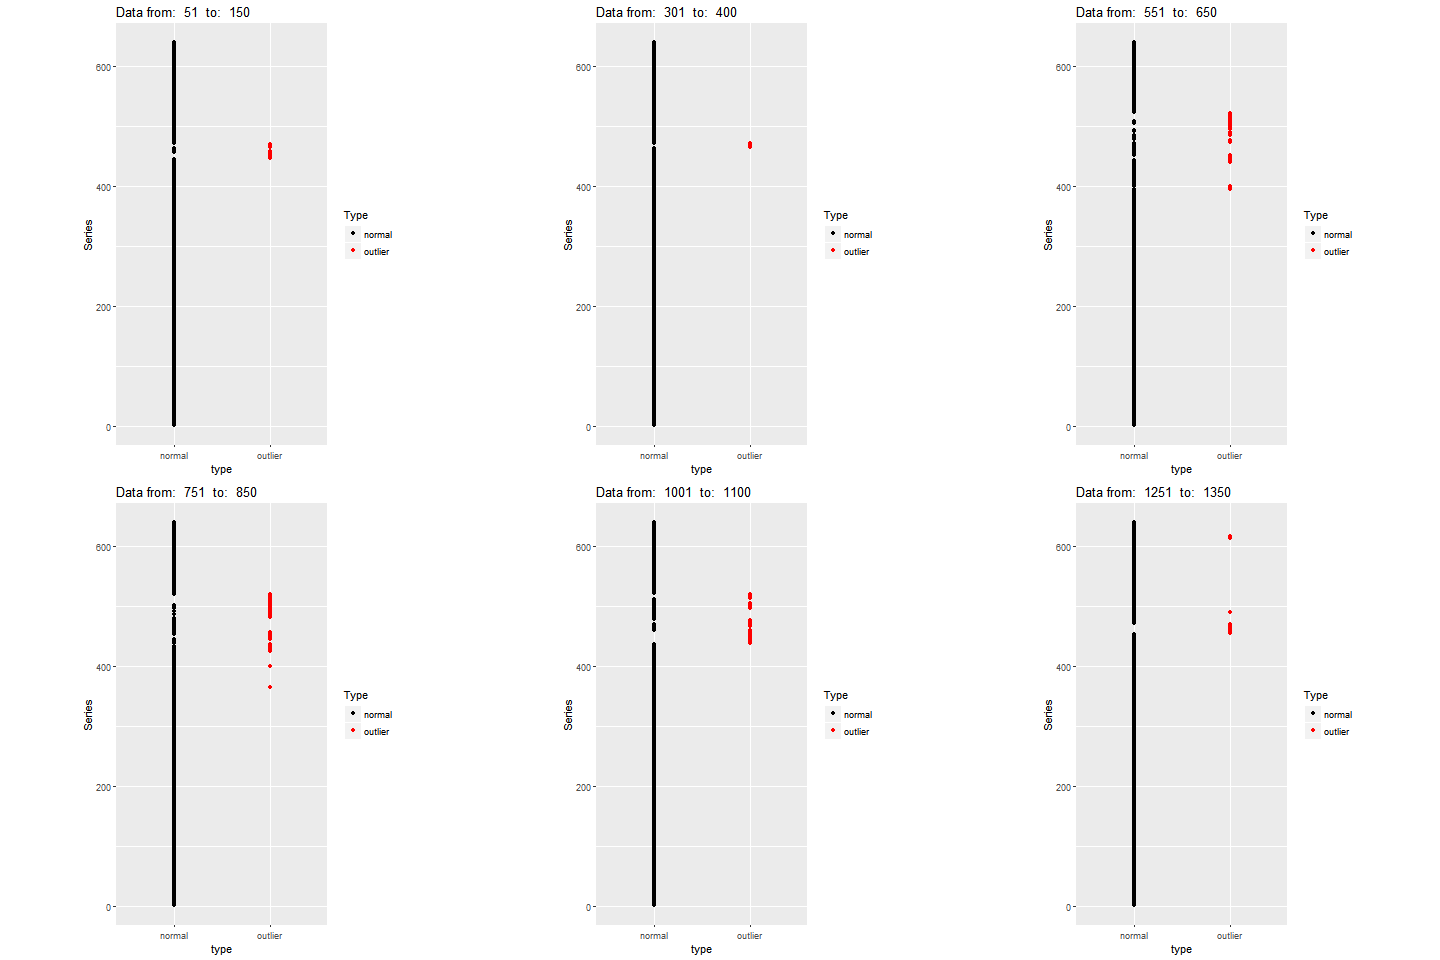
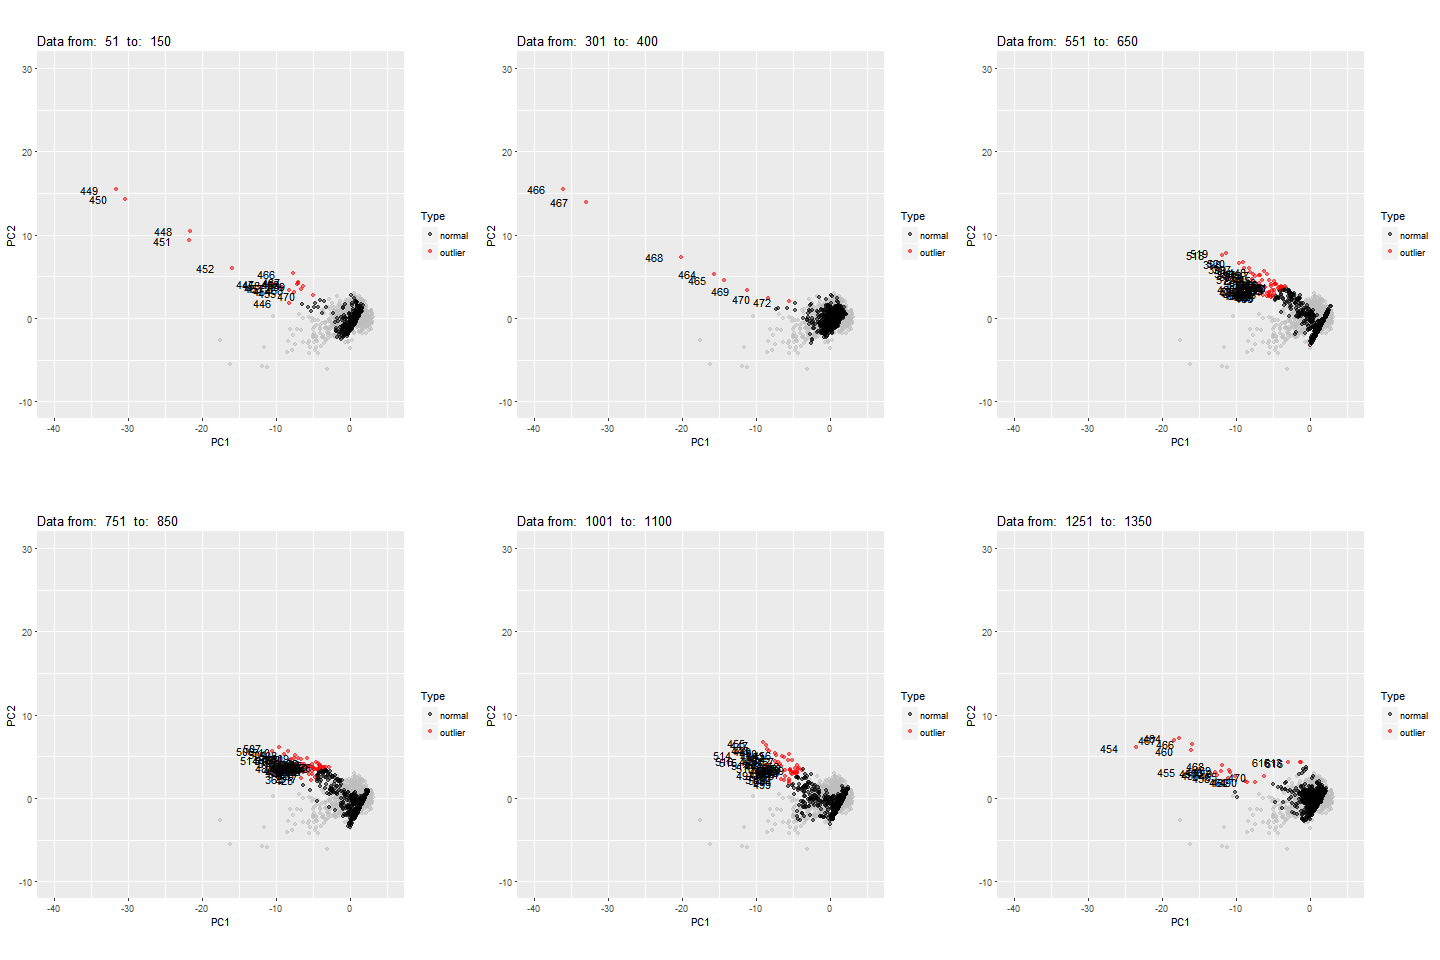
Feature Based Representation of Time series

Anomaly Detection with
Non-stationarity
Anomaly detection with non-stationarity
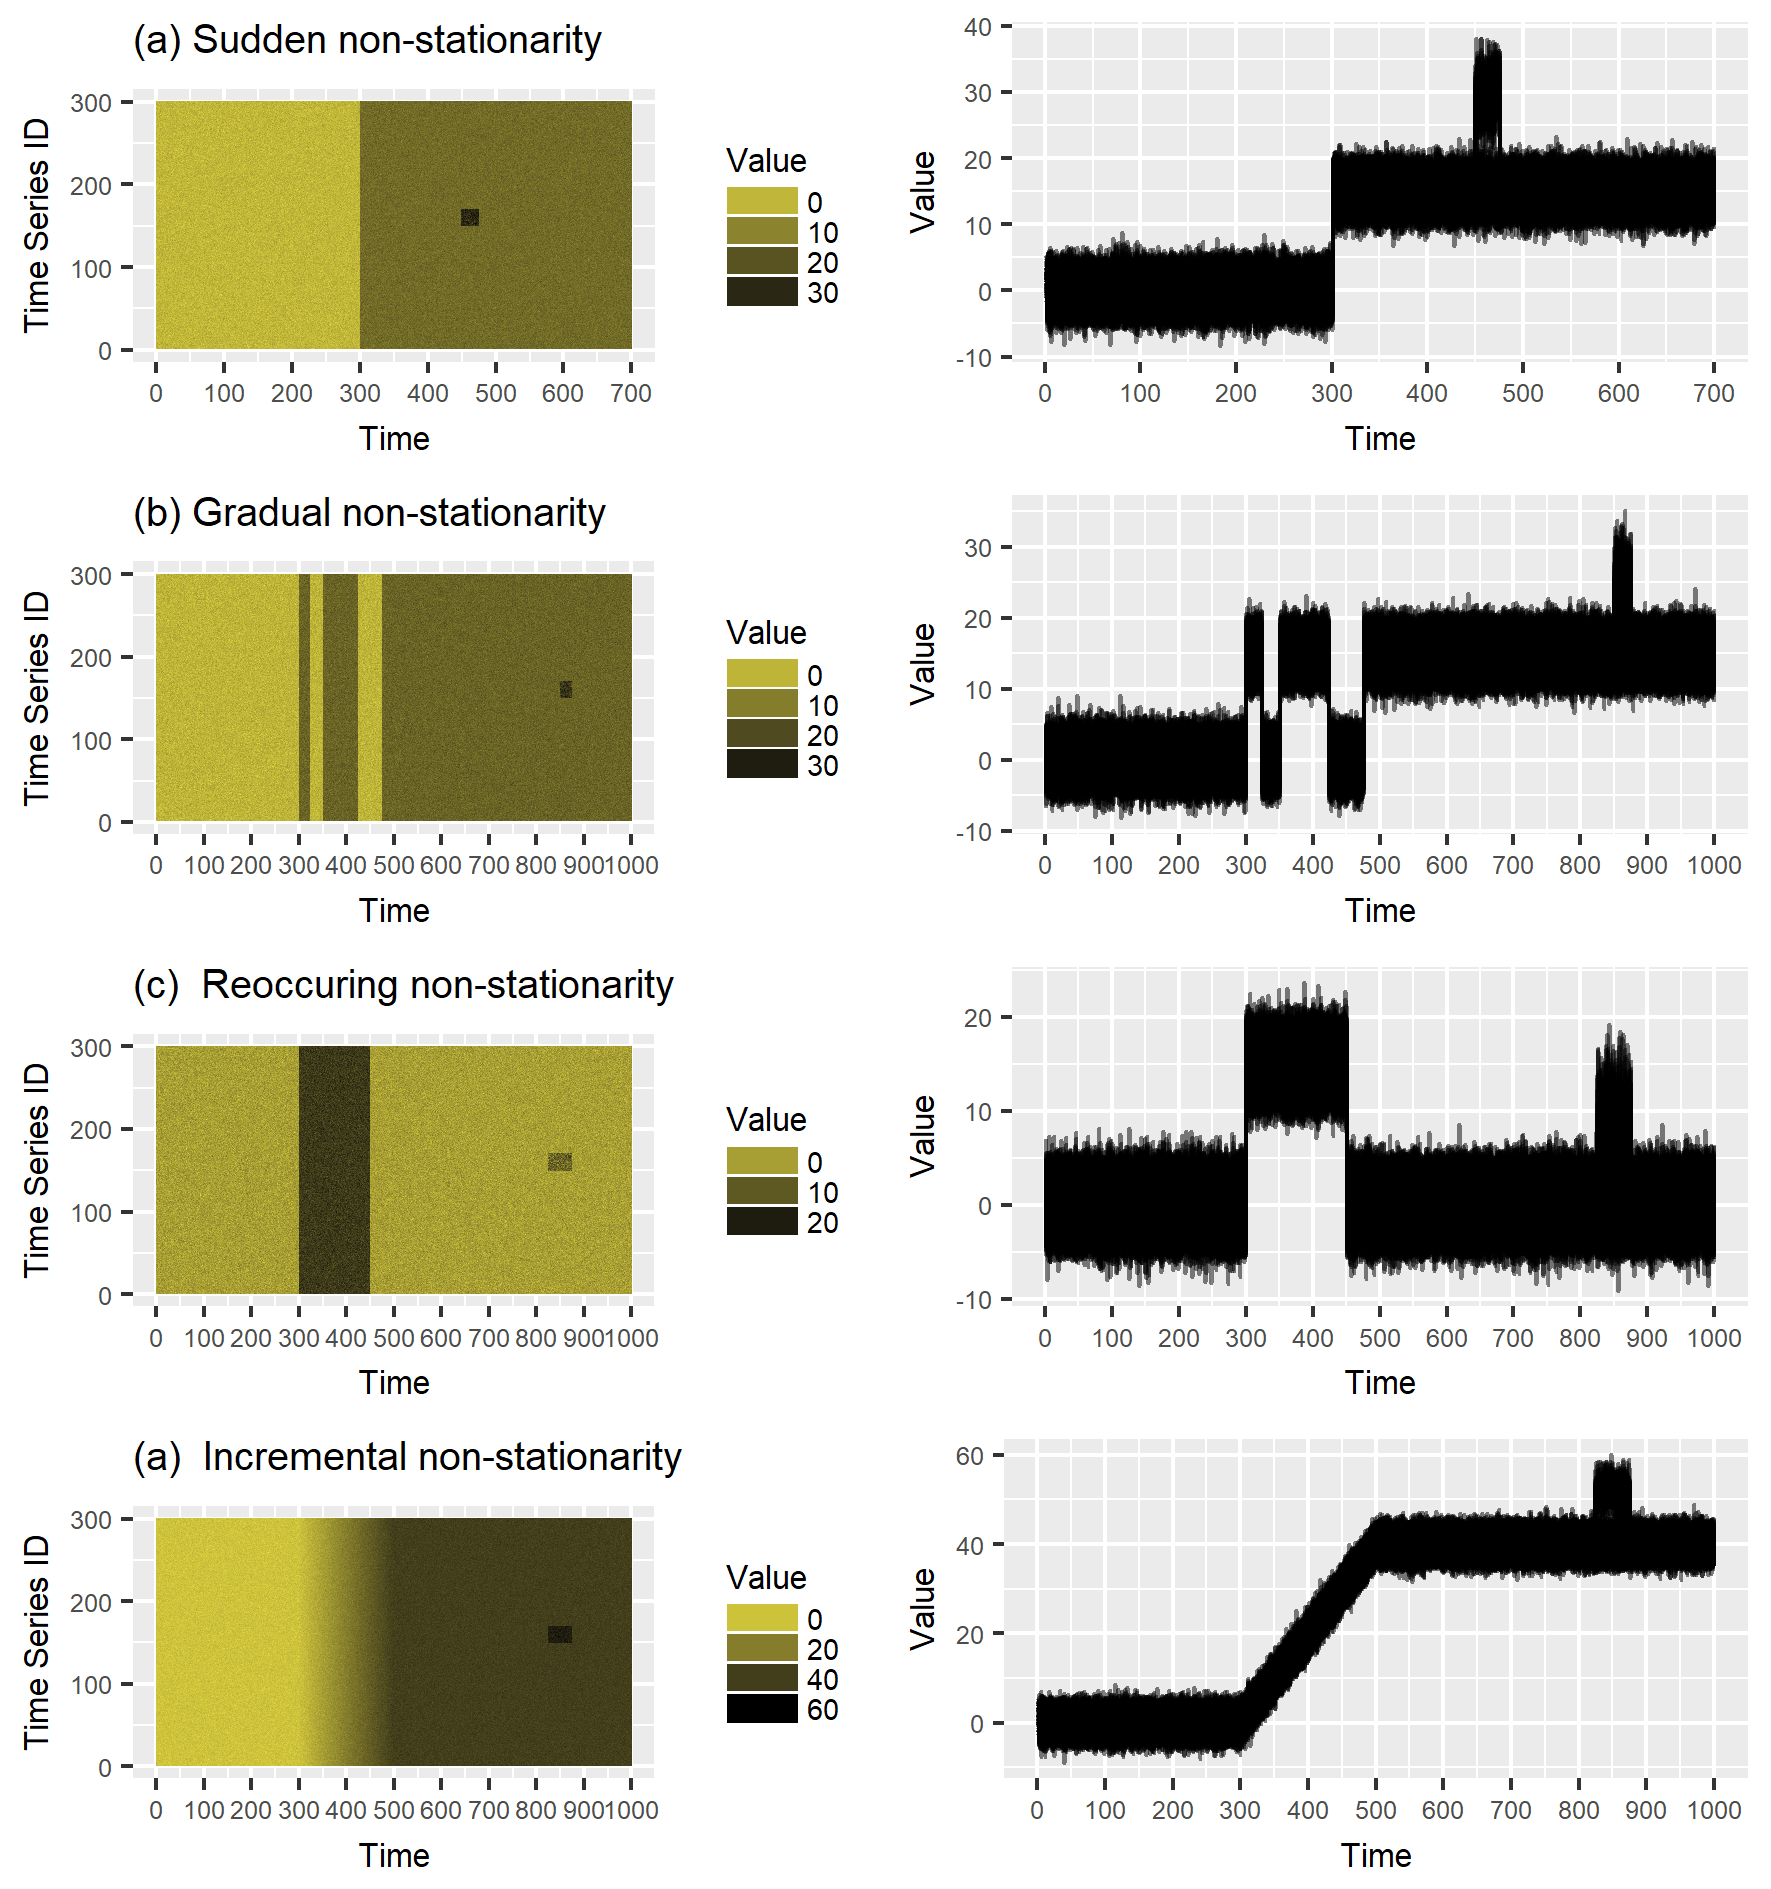
Anomaly detection with non-stationarity

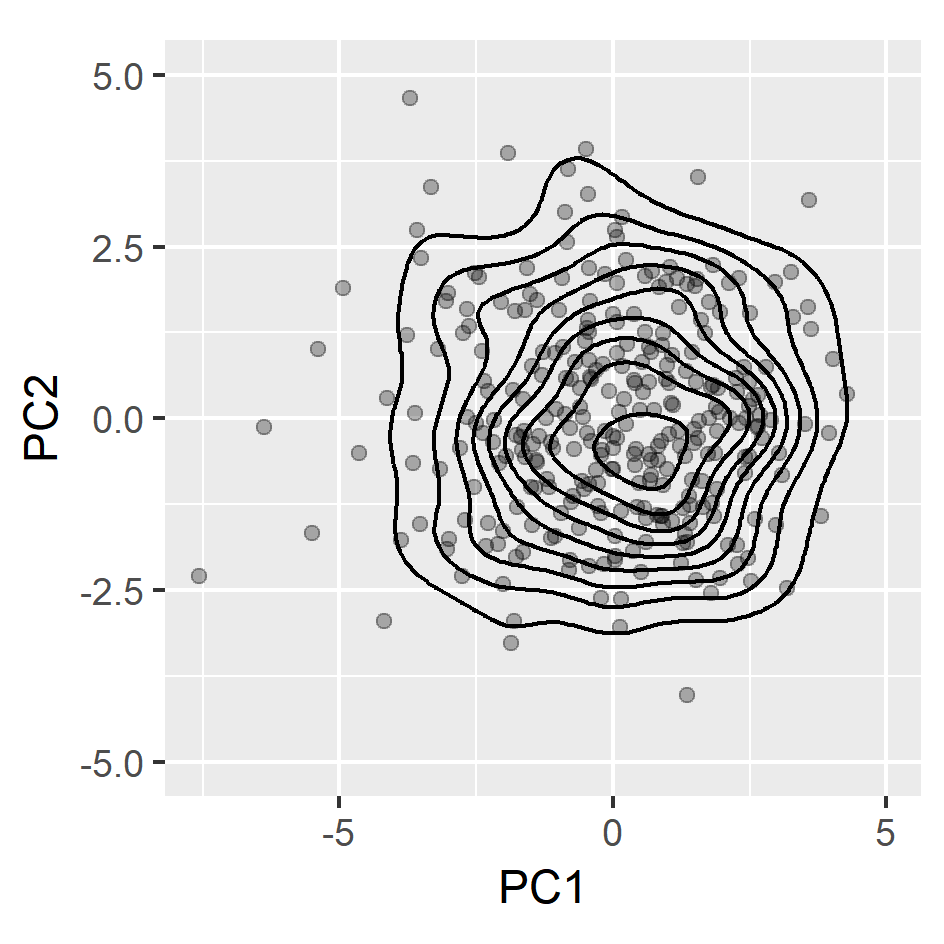
Anomaly detection with non-stationarity

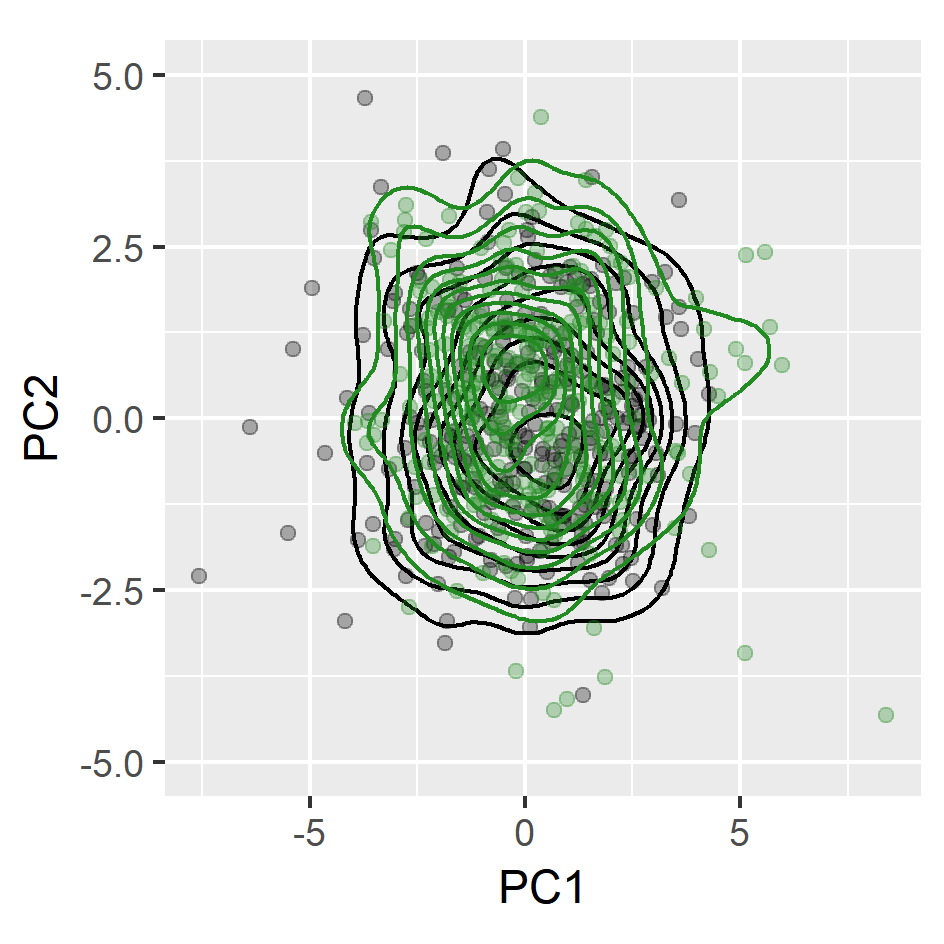
Anomaly detection with non-stationarity

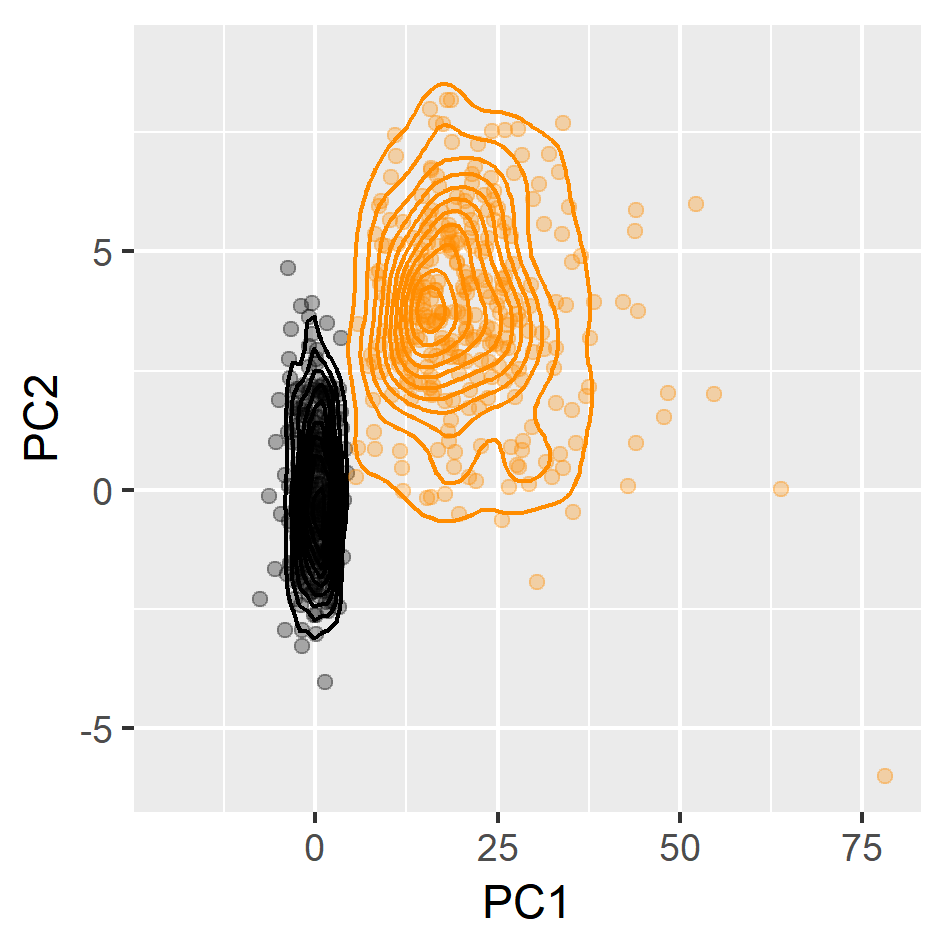
Anomaly detection with non-stationarity


- H0:ft0=ftt
- squared discrepancy measure T=∫[ft0(x)−ftt(x)]2dx (Anderson et al., 1994)
Anomaly detection with non-stationarity
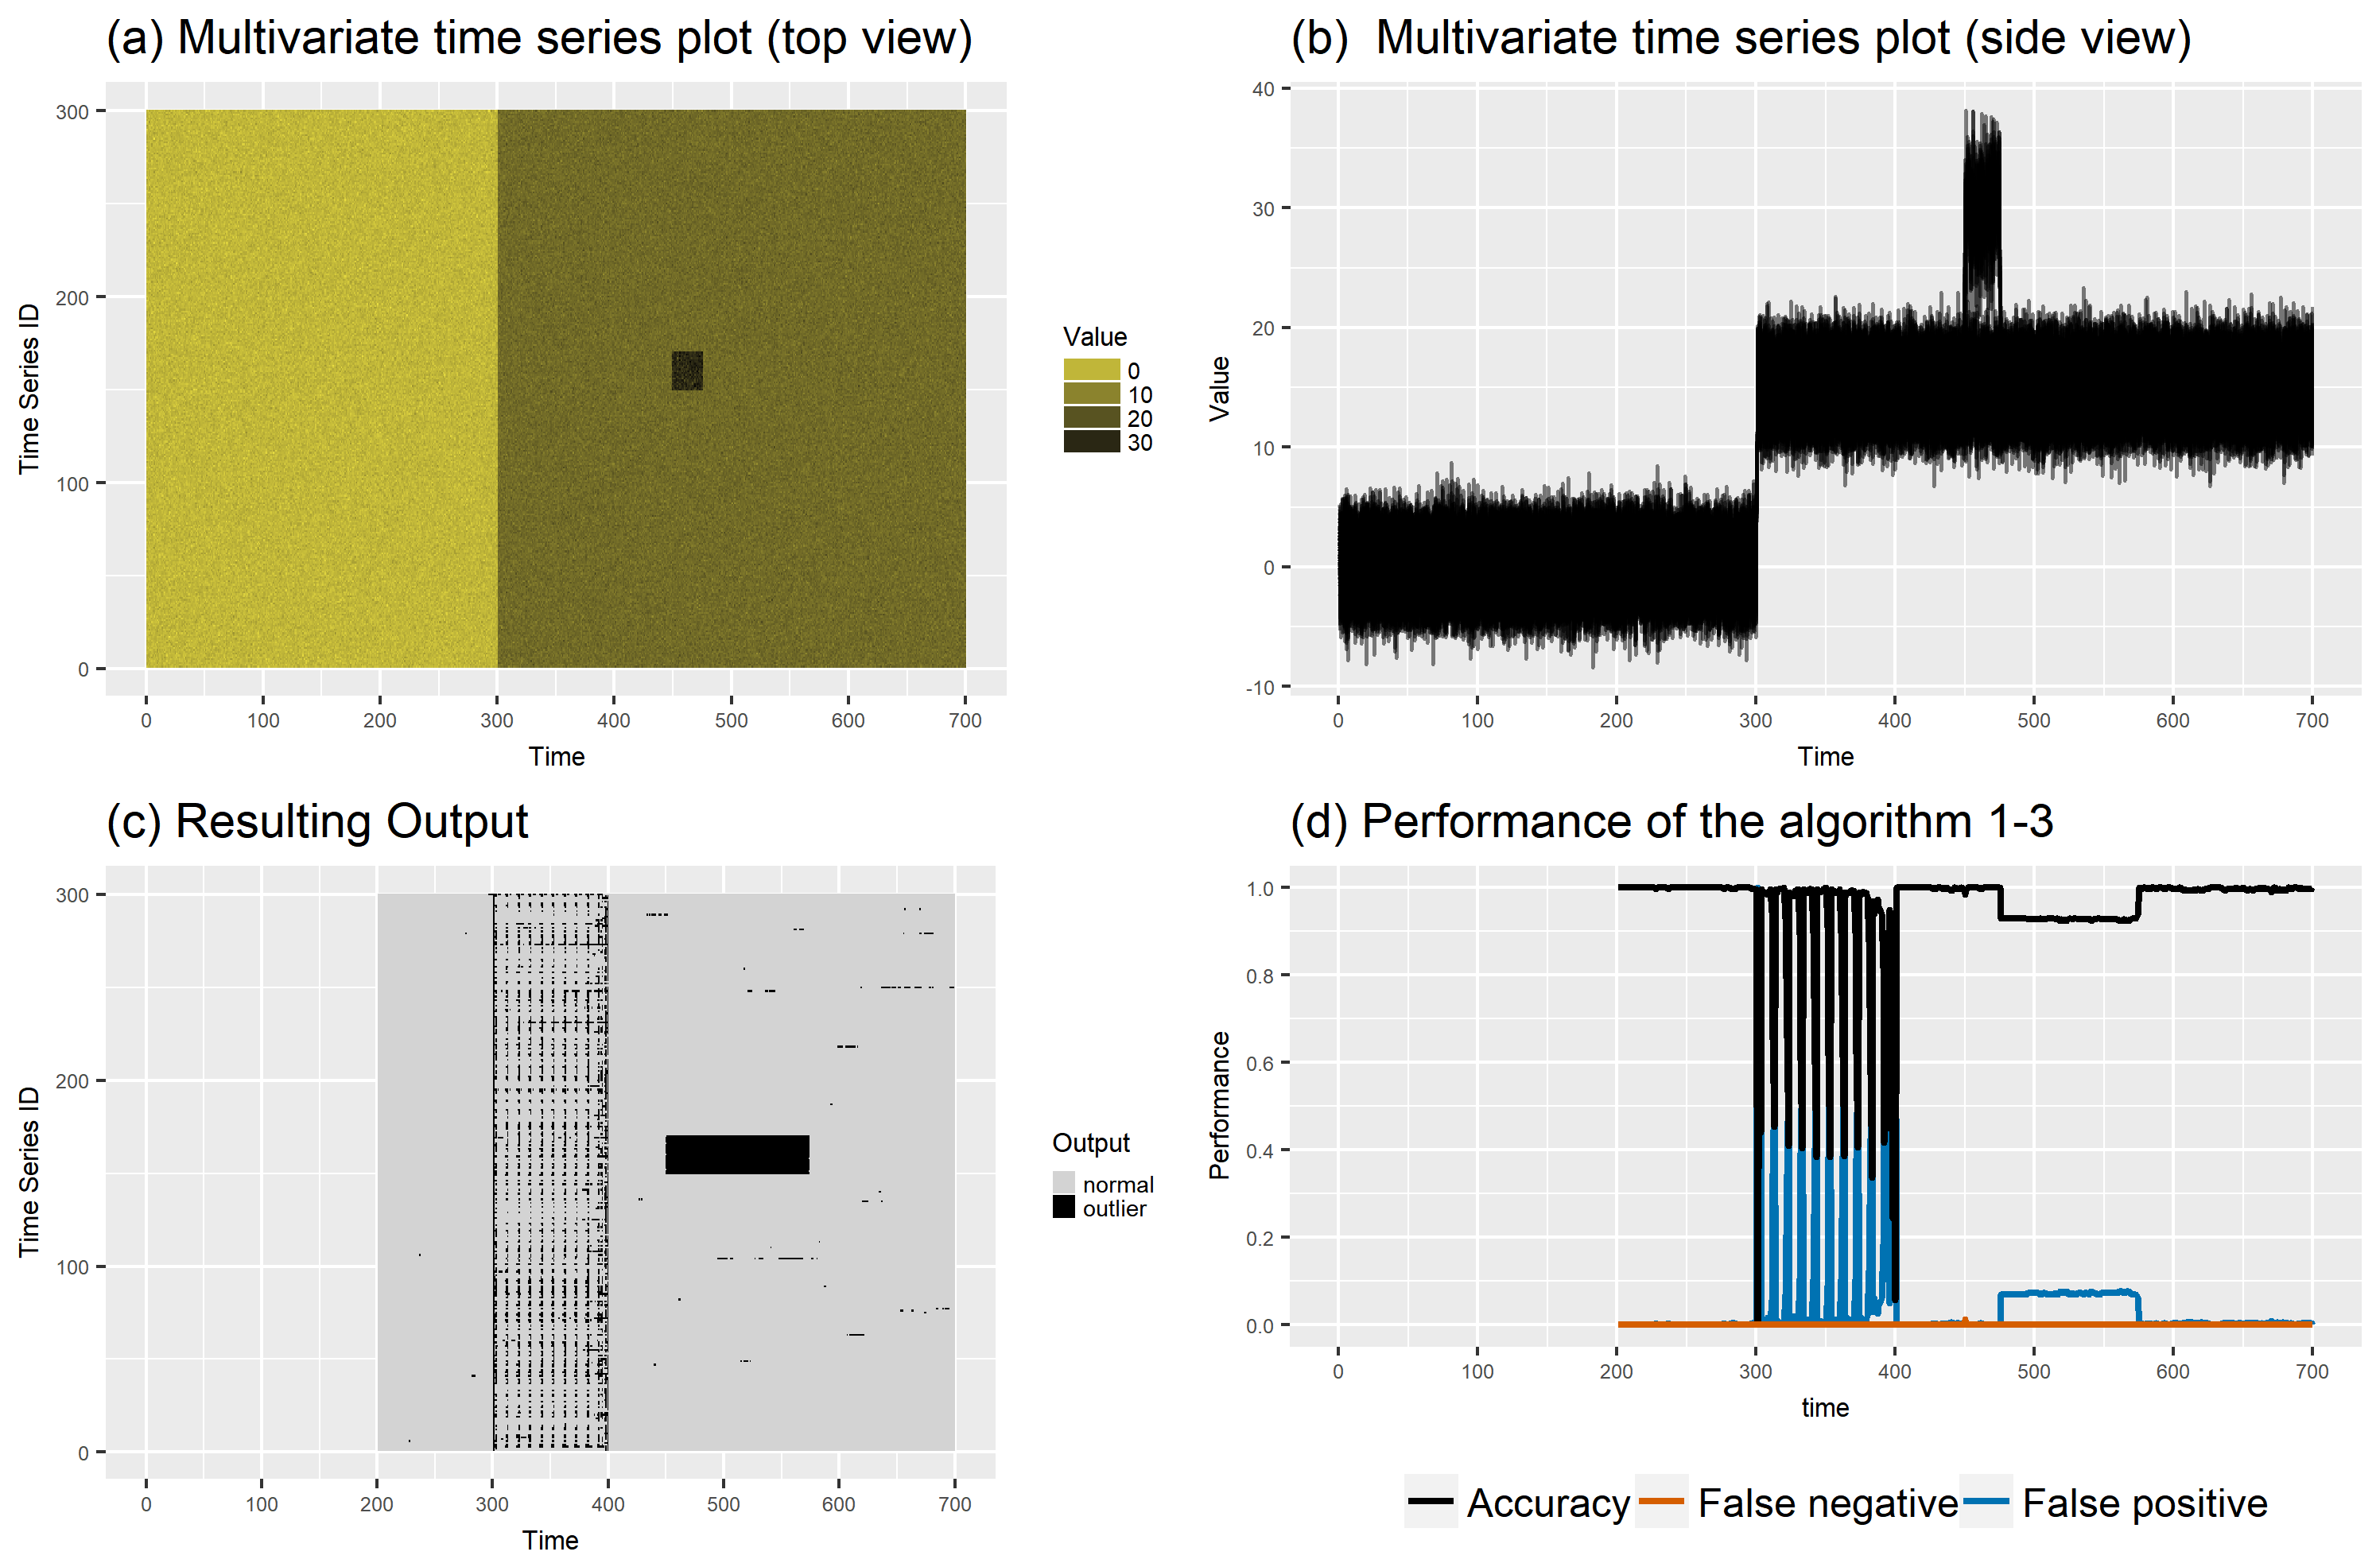
stray
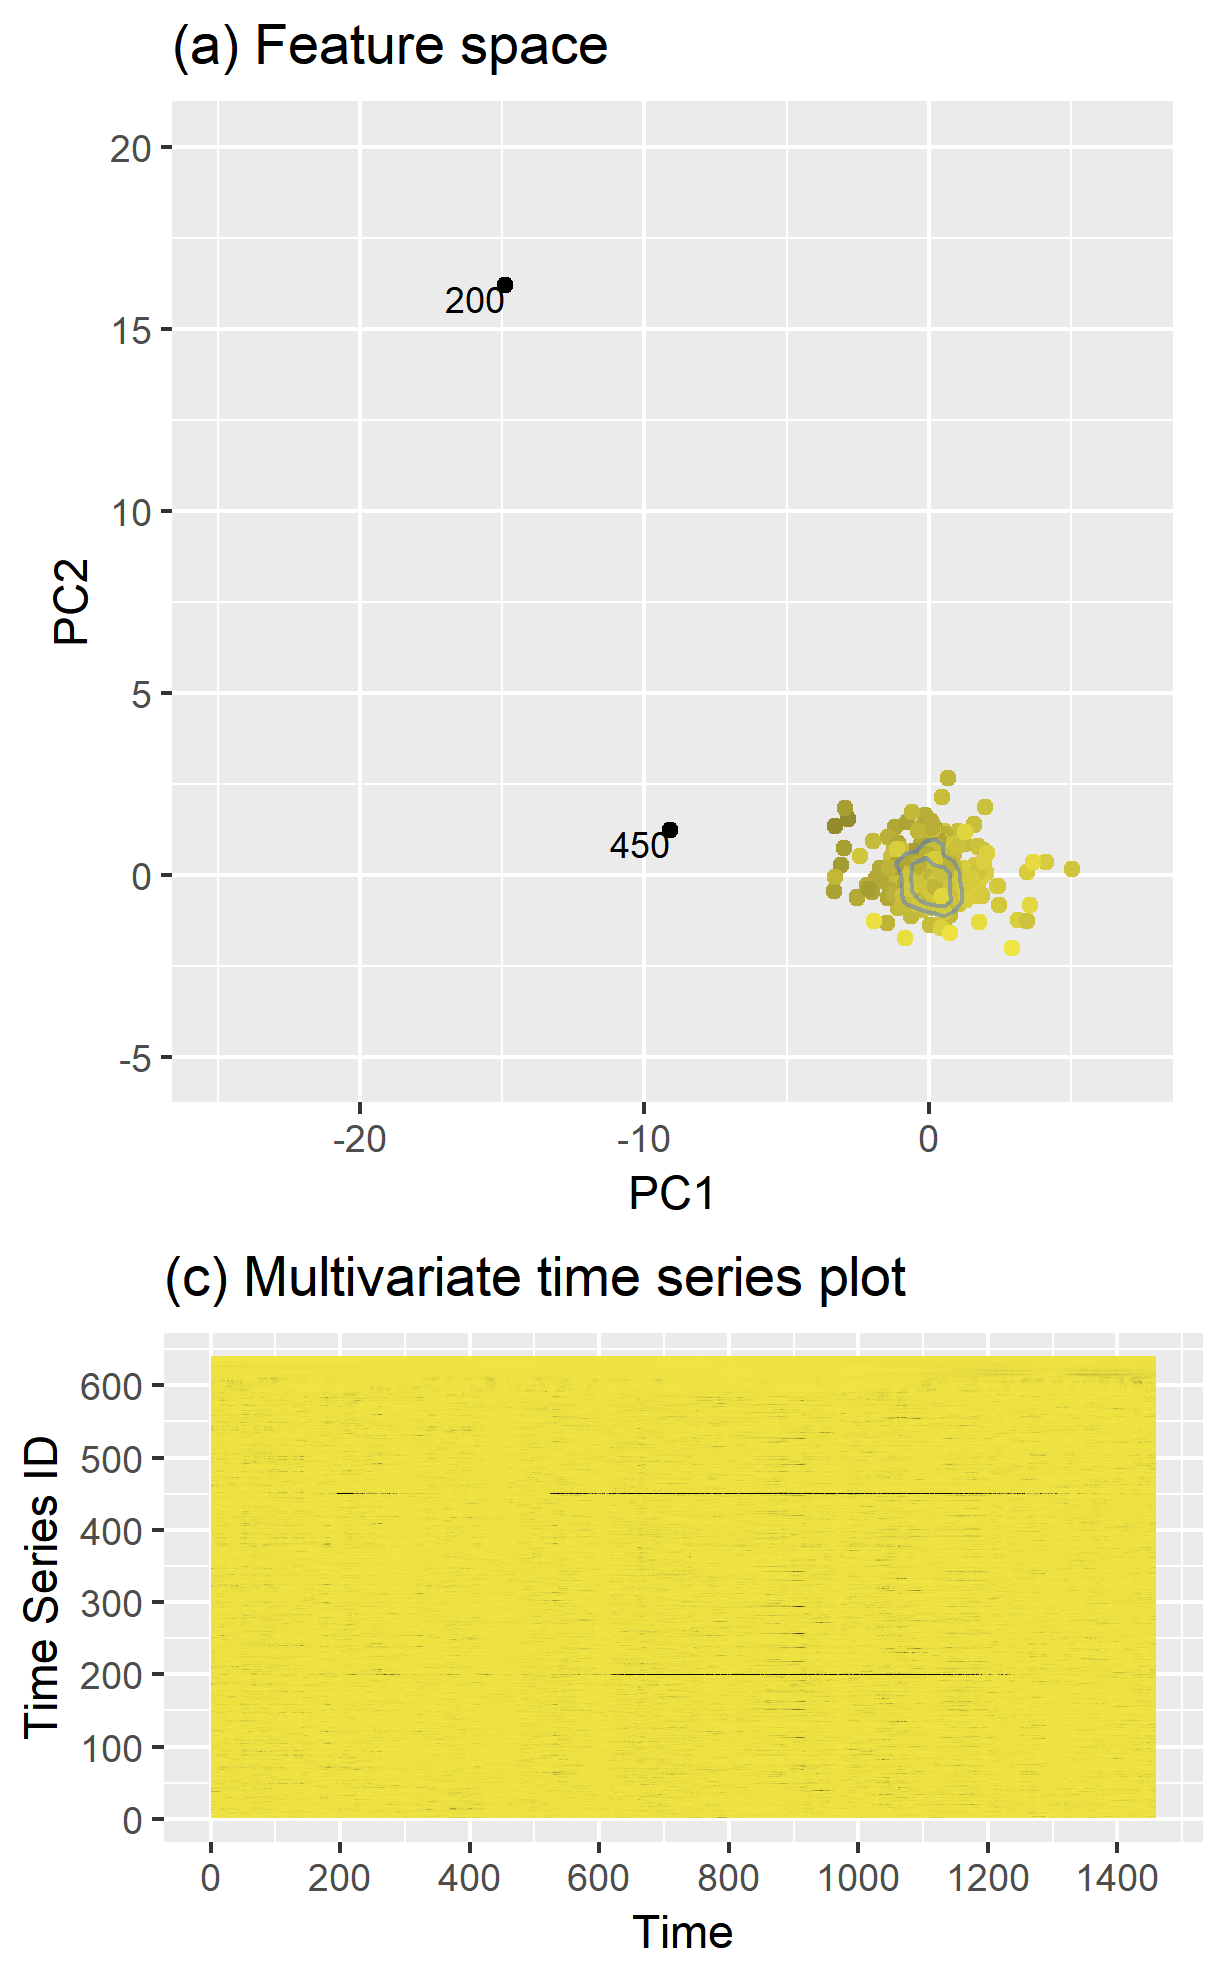
- Definition: distance
- no training set
oddstream
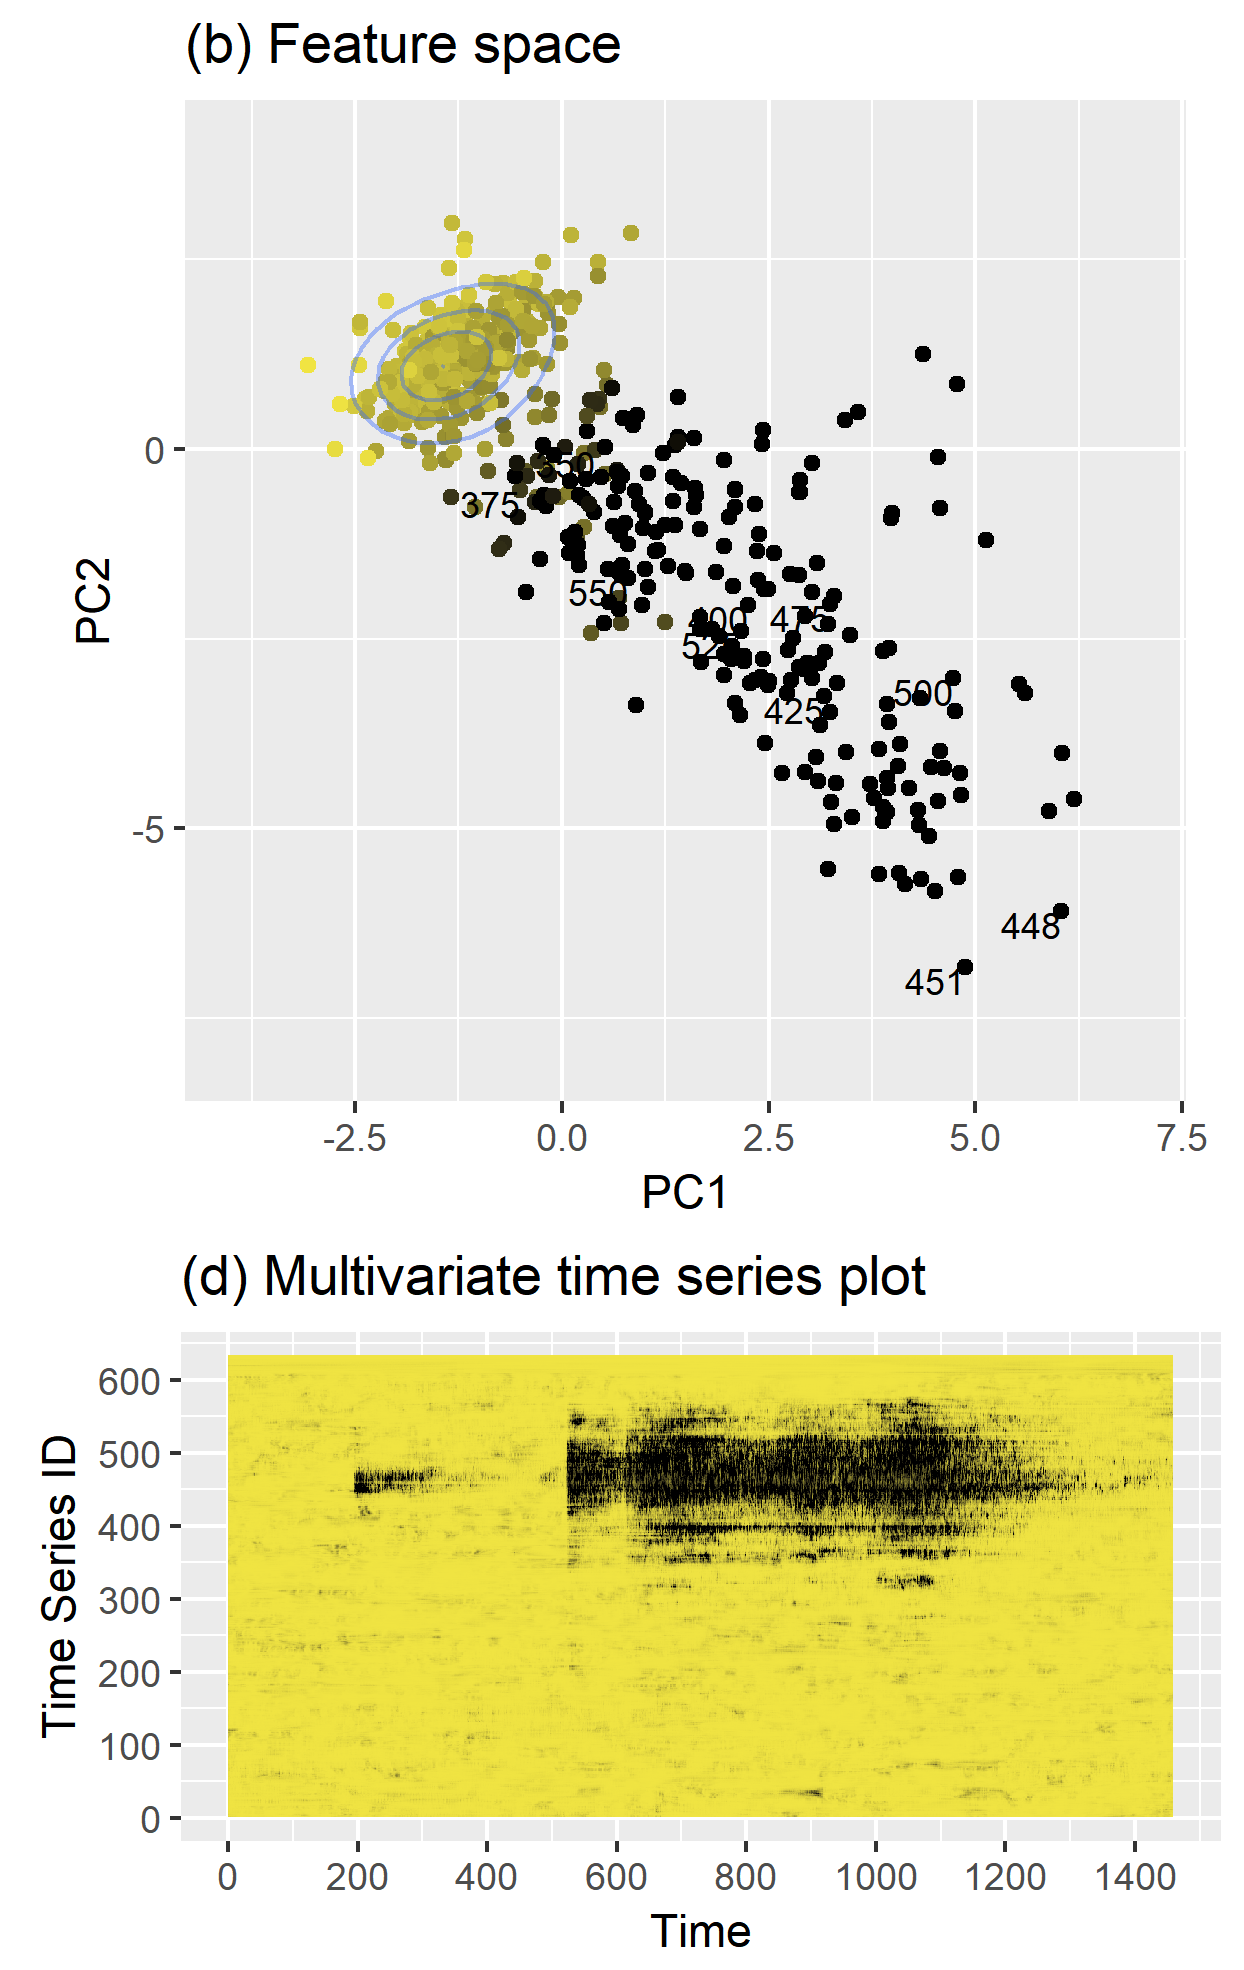
- Definition: density
- need a training set

Priyanga Dilini Talagala, Rob J Hyndman, Kate Smith-Miles, (2020) Anomaly detection in high-dimensional data. Journal of Computational & Graphical Statistics, to appear

on CRAN

Priyanga Dilini Talagala, Rob J Hyndman, Kate Smith-Miles, Sevvandi Kandanaarachchi and Mario A Munoz (2020) Anomaly detection in streaming nonstationary temporal data. Journal of Computational & Graphical Statistics, 20(1), 13-27.

on CRAN
Anomaly Detection in Image Time Series (ITS)
Image Time Series (ITS)
- A stack of images or a videos - Image Time Series (ITS)
Image Time Series (ITS)
A stack of images or a videos - Image Time Series (ITS)
An ITS is basically a set of images of the same scene, ordered chronologically.
Image Time Series (ITS)
A stack of images or a videos - Image Time Series (ITS)
An ITS is basically a set of images of the same scene, ordered chronologically.
It can be encoded as a data-cube, two spatial and one temporal dimensions.
Image Time Series (ITS)
A stack of images or a videos - Image Time Series (ITS)
An ITS is basically a set of images of the same scene, ordered chronologically.
It can be encoded as a data-cube, two spatial and one temporal dimensions.
The acquisition of an ITS can be done with one or multiple sensors to obtain a larger data series with a high temporal frequency.
The produced 2D+t data carry rich spatial and temporal information that must be taken into account to understand particular phenomena not being observable from a single image of the sequence.
Satellite Image Time Series (SITS)
- A Satellite Image Time Series (SITS) is a set of satellite images taken from the same scene at different times
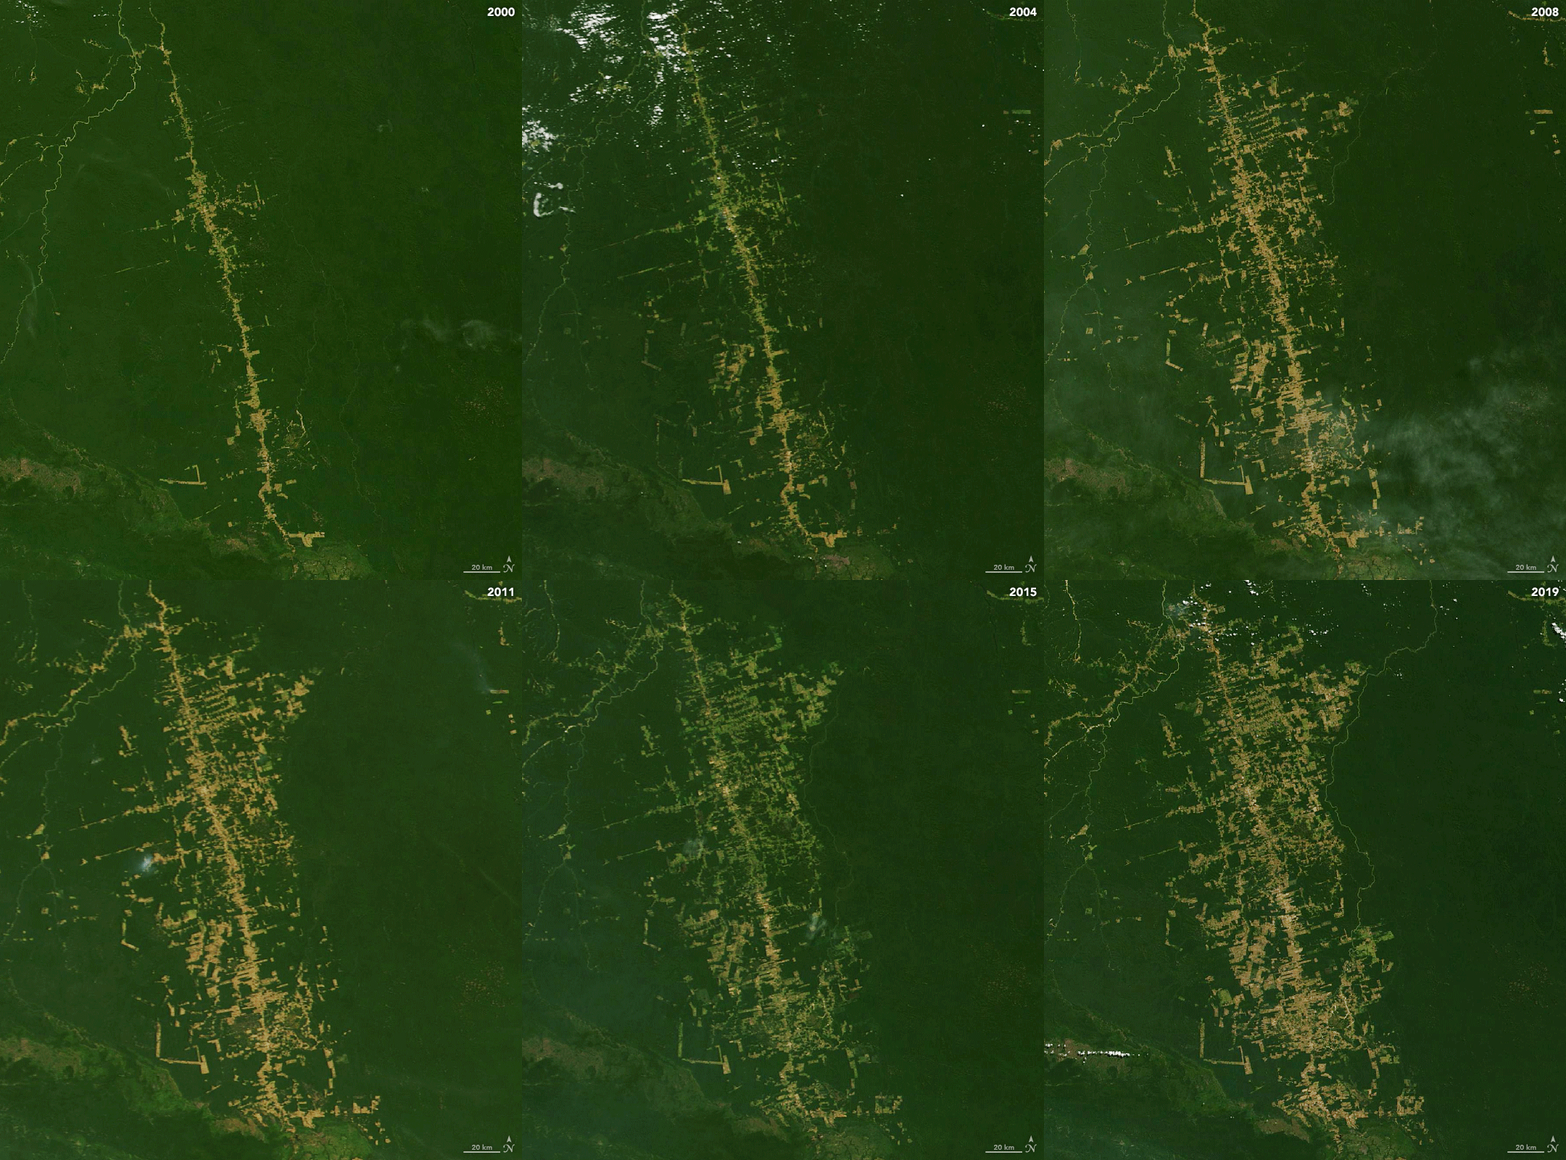
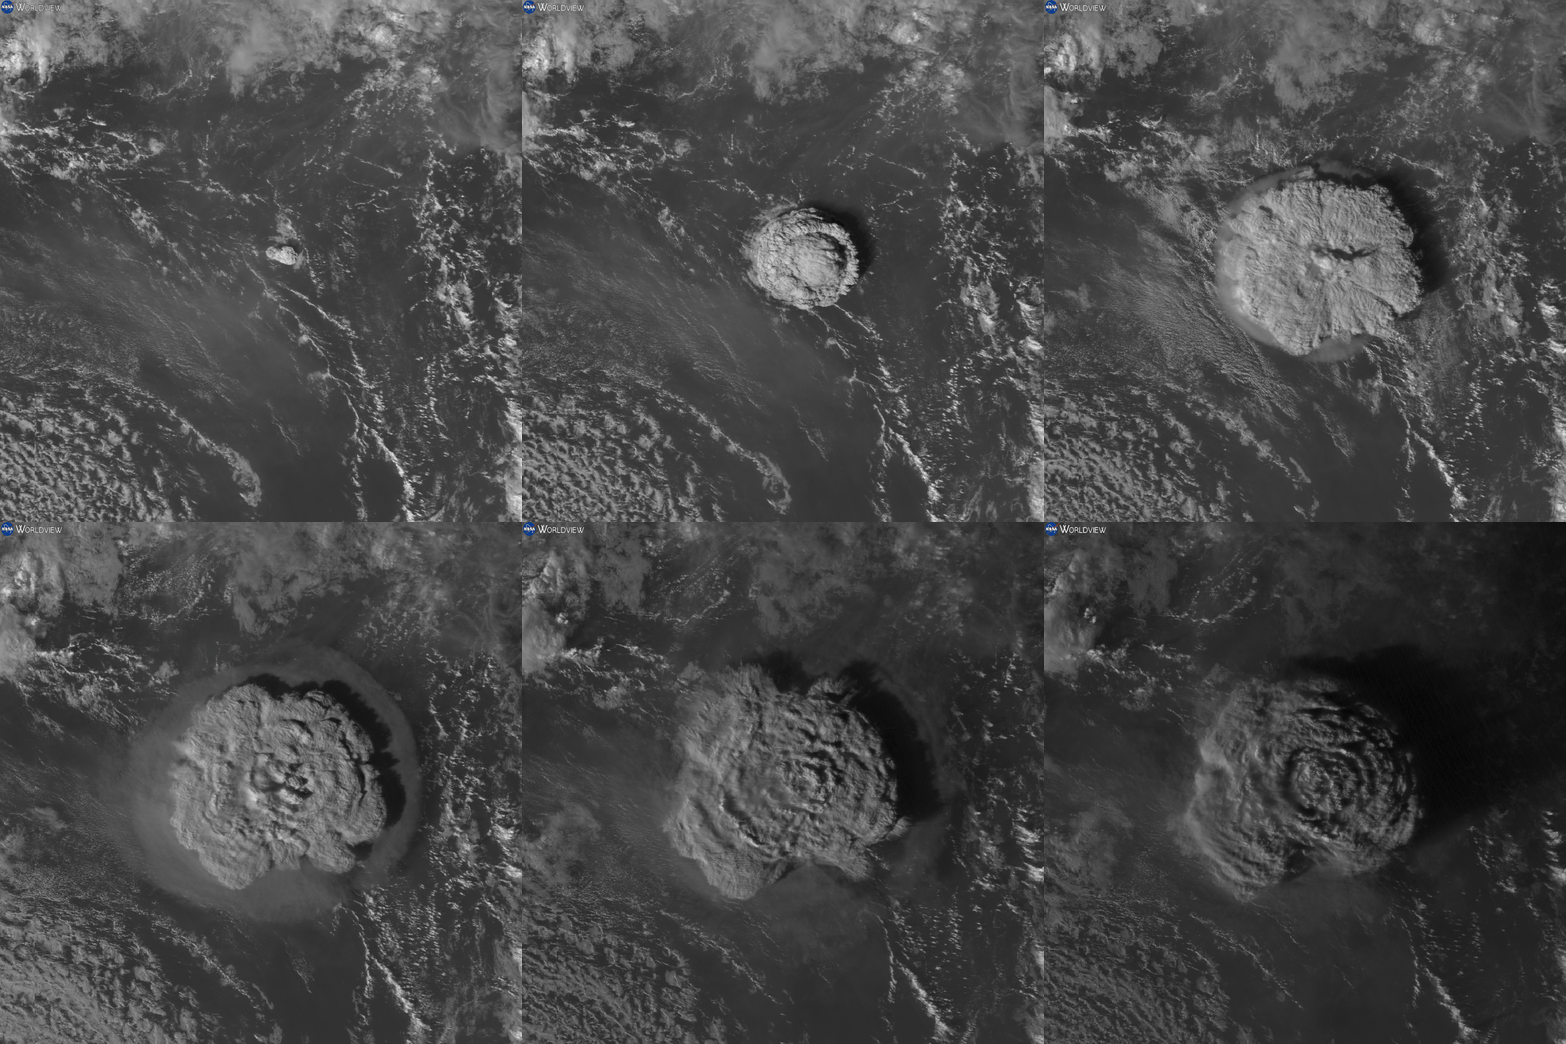
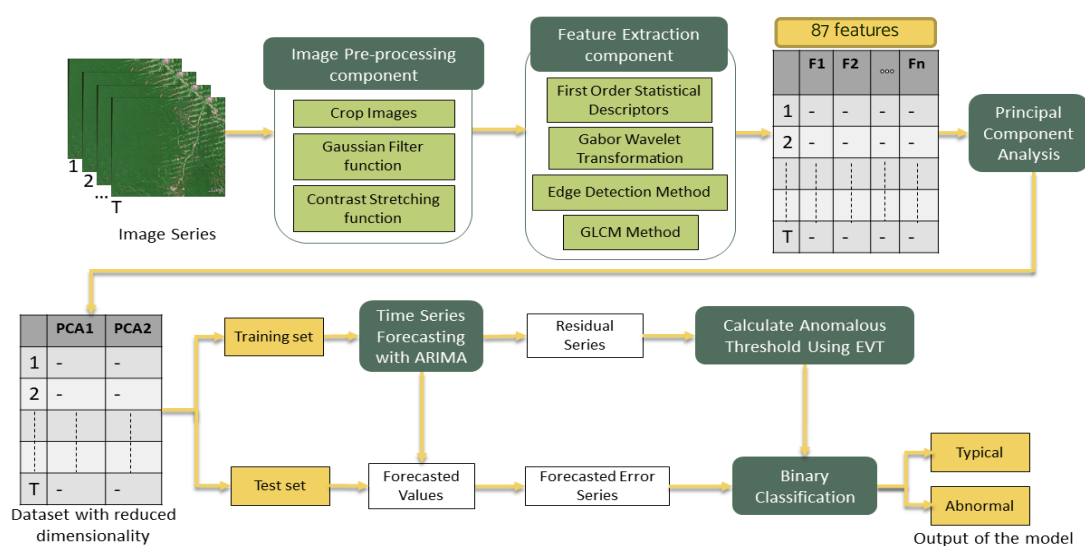
Approach 1: Traditional Machine Learning Approach
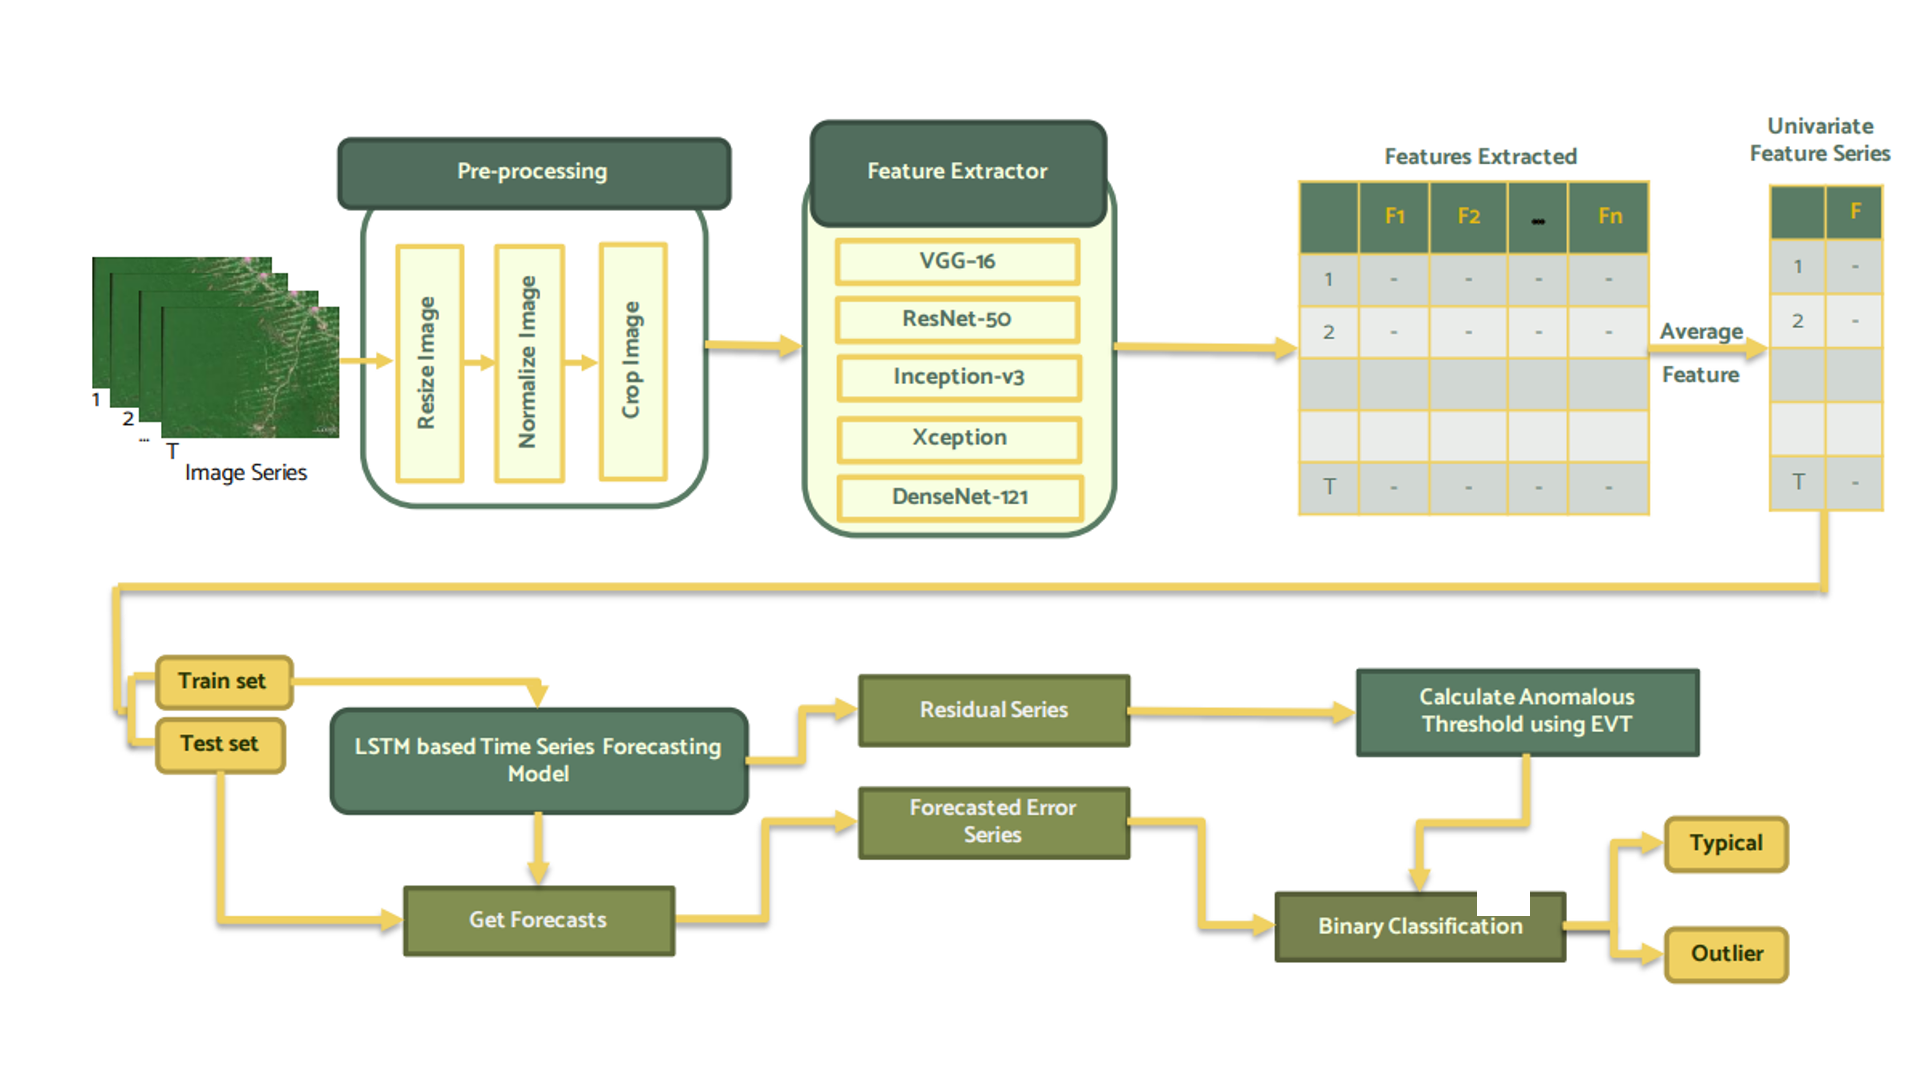
Approach 2: Deep Learning Approach
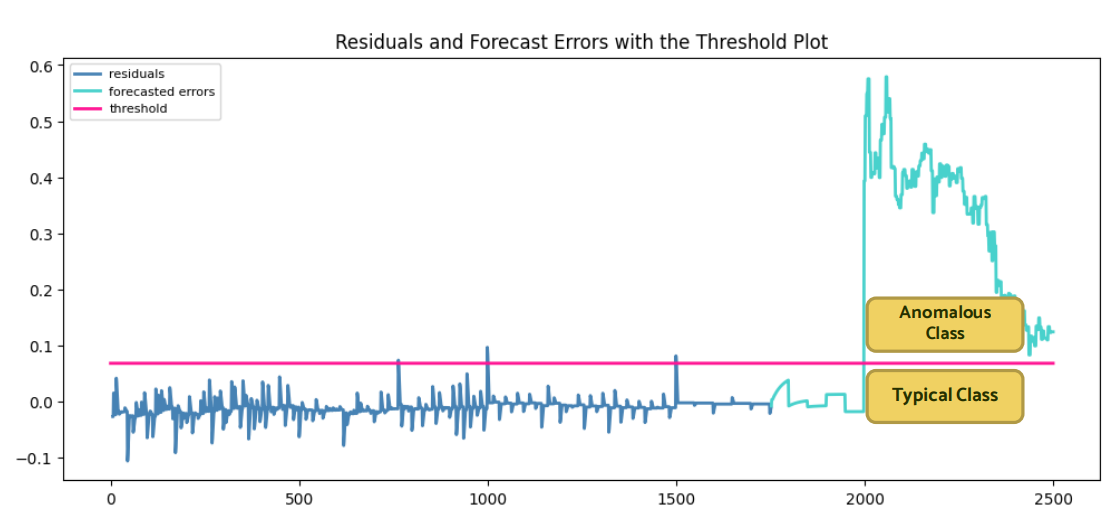
Binary Classification using EVT based Threshold
Fisher-Tippett theorem, limit laws for maxima
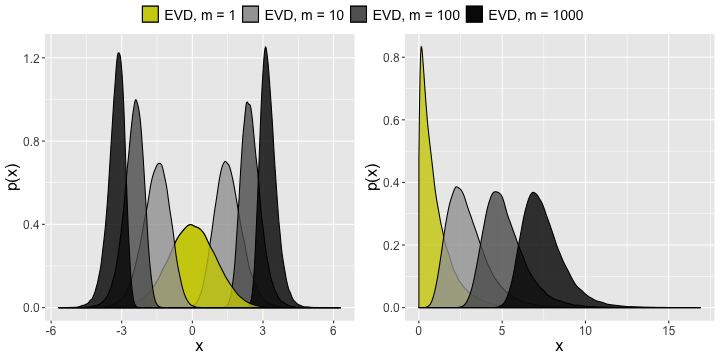
- Asymptotic distribution of extreme order statistics
- The maximum (minima) of a sample of iid random variables after proper renormalization can only converge in distribution to one of 3 possible distributions, the Gumbel distribution, the Fréchet distribution, or the Weibull distribution.
EVT based Anomaly Threshold Calculation
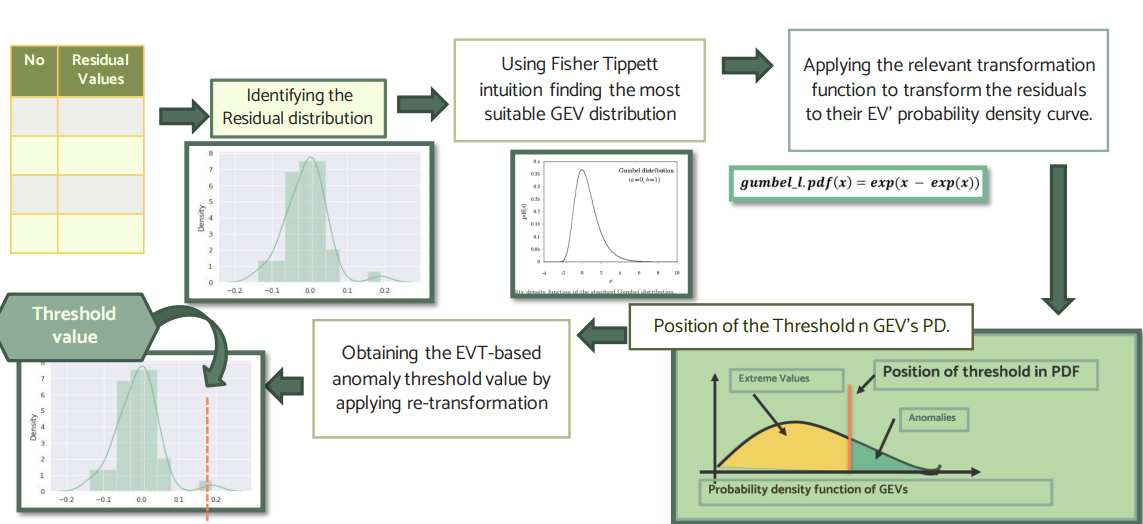
Binary Classification using EVT based Threshold

What Next?
- Explore more on feature extraction and feature selection methods to create a better feature space suitable for streaming data context.
What Next?
- Explore more on feature extraction and feature selection methods to create a better feature space suitable for streaming data context.
- Use other dimension reduction techniques such as multidimensional scaling analysis, random projection to see the effect on the performance of the proposed framework.
- Do more experiments on density estimation methods to get a better tail estimation.
- Implement a suitable explainable model for anomaly detection in image streams.
- Extend the algorithm to work with Multidimensional Multivariate Data streams
Thank You
priyangad@uom.lk
pridiltal
prital.netlify.app
(Slides and papers available)
The slides are powered by xaringan R package
This work was supported in part by RETINA research lab funded by the OWSD, a program unit of United Nations Educational, Scientific and Cultural Organization (UNESCO).