Anomaly Detection in
Streaming Time Series Data
Priyanga Dilini Talagala
with
Rob J Hyndman
Kate Smith-Miles
Sevvandi Kandanaarachchi
Mario A. Muñoz
Motivation: Fence-mounted perimeter intrusion detection systems

- Data obtained using fiber optic cables attached to a fence
Motivation: Fence-mounted perimeter intrusion detection systems

Data obtained using fiber optic cables attached to a fence
Intrusion events cause measurable changes in intensity, phase, wavelength or transit time of light in the fiber.
Motivation: Fence-mounted perimeter intrusion detection systems

Data obtained using fiber optic cables attached to a fence
Intrusion events cause measurable changes in intensity, phase, wavelength or transit time of light in the fiber.
Aim: Find anomalous time series (the location of the intrusion event)
Motivation: Network intrusion detection systems

- Yahoo data breach in late 2014 --- world's largest ever cyber attack
Motivation: Network intrusion detection systems

Yahoo data breach in late 2014 --- world's largest ever cyber attack
Intrusion attacks cause measurable changes in times of logins, command executed during a single user session, number of password failures
Motivation: Network intrusion detection systems

Yahoo data breach in late 2014 --- world's largest ever cyber attack
Intrusion attacks cause measurable changes in times of logins, command executed during a single user session, number of password failures
- Aim: find anomalous time series (locate intrusion attacks)
Motivation
- All these applications generate millions or even billions of individual time series simultaneously
Motivation
All these applications generate millions or even billions of individual time series simultaneously
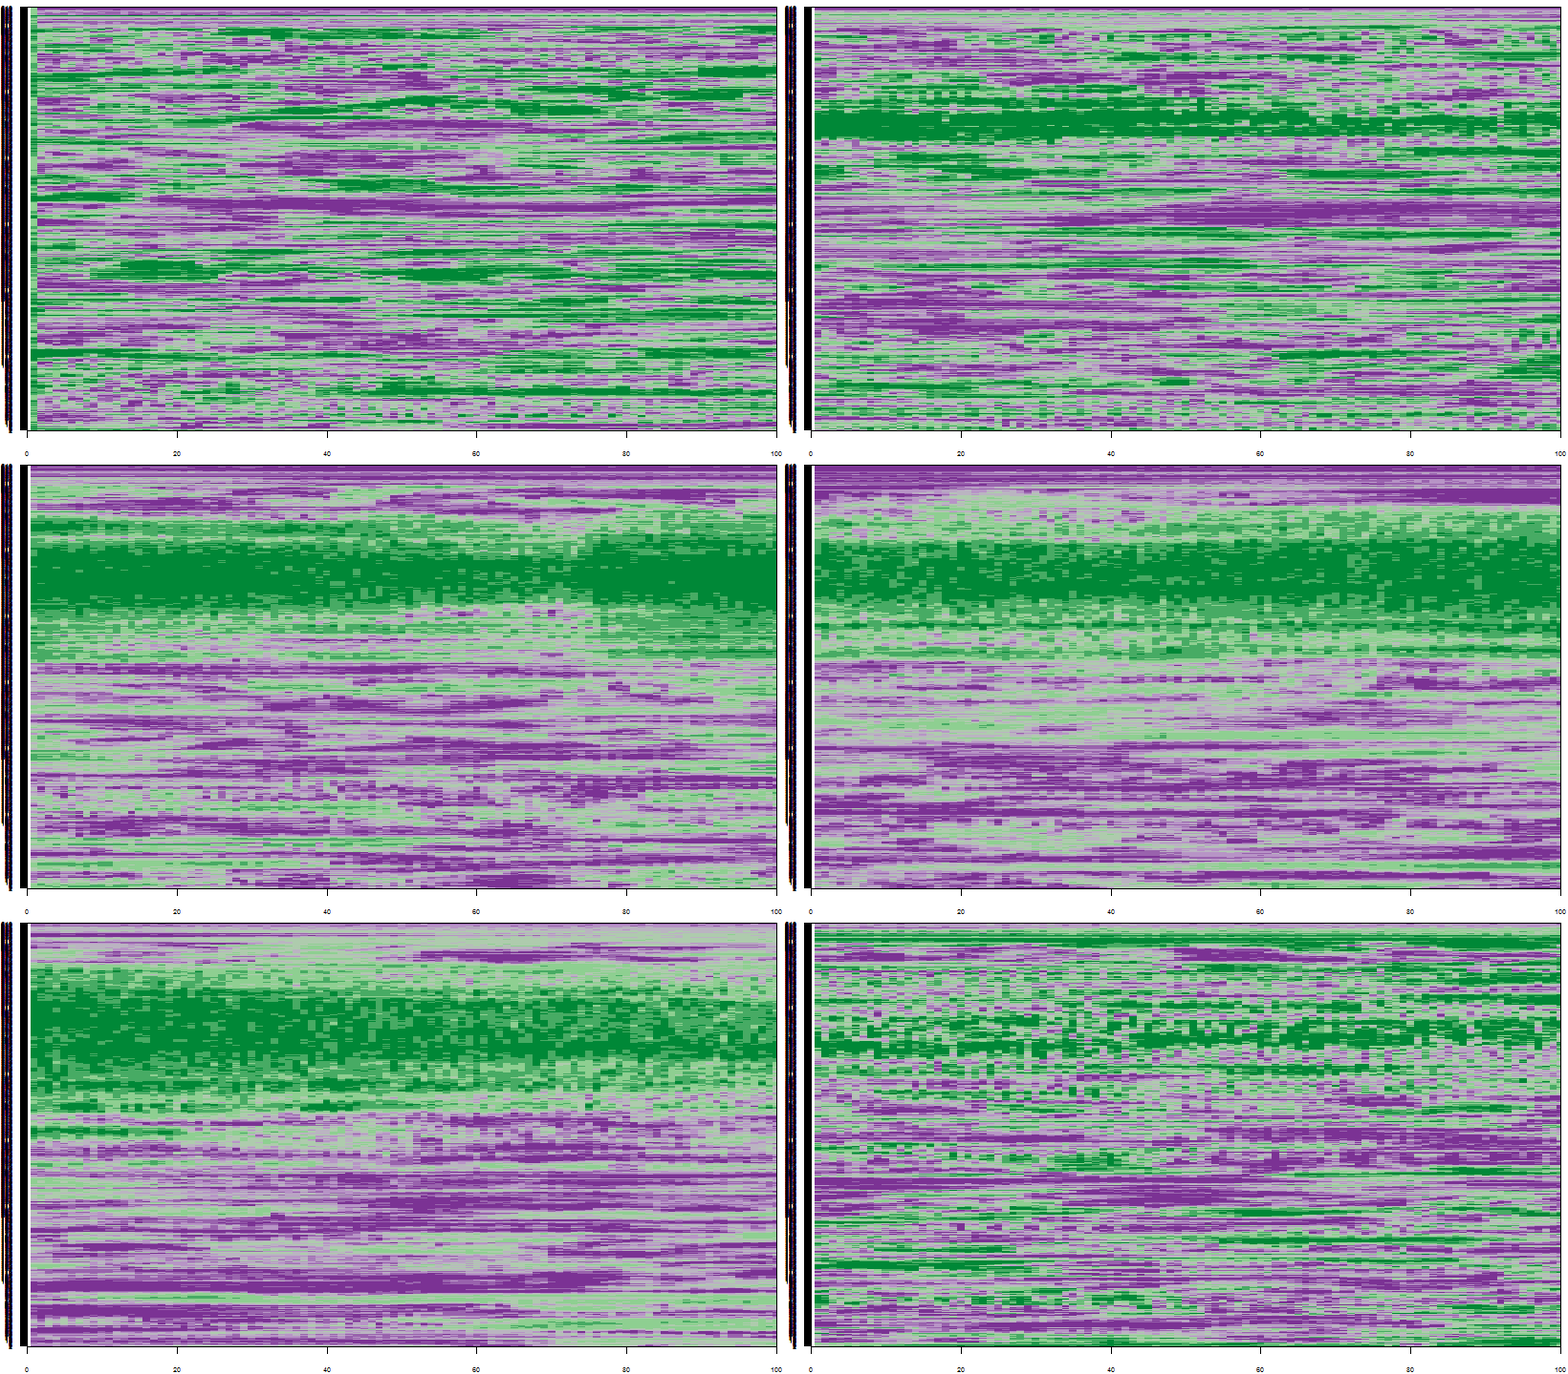
Research question: Finding anomalous time series within a large collection of time series
Motivation
All these applications generate millions or even billions of individual time series simultaneously
Research question: Finding anomalous time series within a large collection of time series
Approaches to solving the problem of anomaly detection for temporal data :
Motivation
All these applications generate millions or even billions of individual time series simultaneously
Research question: Finding anomalous time series within a large collection of time series
Approaches to solving the problem of anomaly detection for temporal data :
Batch scenario:
whole set of data is available, focus - complete events
Data stream scenario: continuous, unbounded, flow at high speed, high volume
Automatic anomaly detection algorithm for streaming data is required:
- to give real-time support
Automatic anomaly detection algorithm for streaming data is required:
- to give real-time support
- to provide early detection of anomalies
Automatic anomaly detection algorithm for streaming data is required:
- to give real-time support
- to provide early detection of anomalies
- to learn and adapt to the changing environment automatically (concept drift)
Automatic anomaly detection algorithm for streaming data is required:
- to give real-time support
- to provide early detection of anomalies
- to learn and adapt to the changing environment automatically (concept drift)
- to deal with large amounts of data efficiently
What is an anomaly ?
Image credit: Wikimedia Commons
What is an anomaly ?
- By definition, anomalies are rare in comparison to a system's typical behaviour.
- We define an anomaly as an observation that is very unlikely given the forecast distribution.
Algorithm of the proposed framework
Aim
- To detect anomalous time series within a large collection of time series in a streaming data context
Algorithm of the proposed framework
Aim
- To detect anomalous time series within a large collection of time series in a streaming data context
Main Assumptions
Algorithm of the proposed framework
Aim
- To detect anomalous time series within a large collection of time series in a streaming data context
Main Assumptions
- Anomaly is a rare event which has a very low chance of occurrence with respect to the typical behavior of the system
Algorithm of the proposed framework
Aim
- To detect anomalous time series within a large collection of time series in a streaming data context
Main Assumptions
Anomaly is a rare event which has a very low chance of occurrence with respect to the typical behavior of the system
A representative data set of the system's typical behavior is available to define the model for the typical behavior of the system.
Proposed Algorithm
- Off-line Phase: Forecast a boundary for system's typical behavior (similar to (Clifton, Hugueny & Tarassenko, 2011))
Algorithm of the proposed framework
Aim
- To detect anomalous time series within a large collection of time series in a streaming data context
Main Assumptions
Anomaly is a rare event which has a very low chance of occurrence with respect to the typical behavior of the system
A representative data set of the system's typical behavior is available to define the model for the typical behavior of the system.
Proposed Algorithm
Off-line Phase: Forecast a boundary for system's typical behavior (similar to (Clifton, Hugueny & Tarassenko, 2011))
On-line Phases: Testing newly arrived data using the boundary
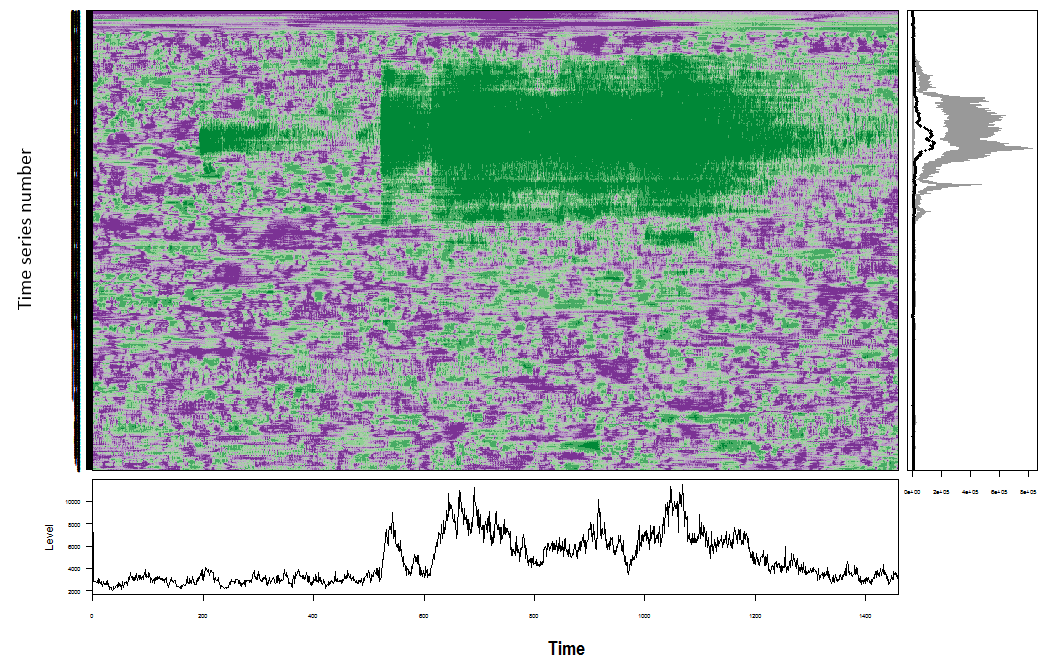
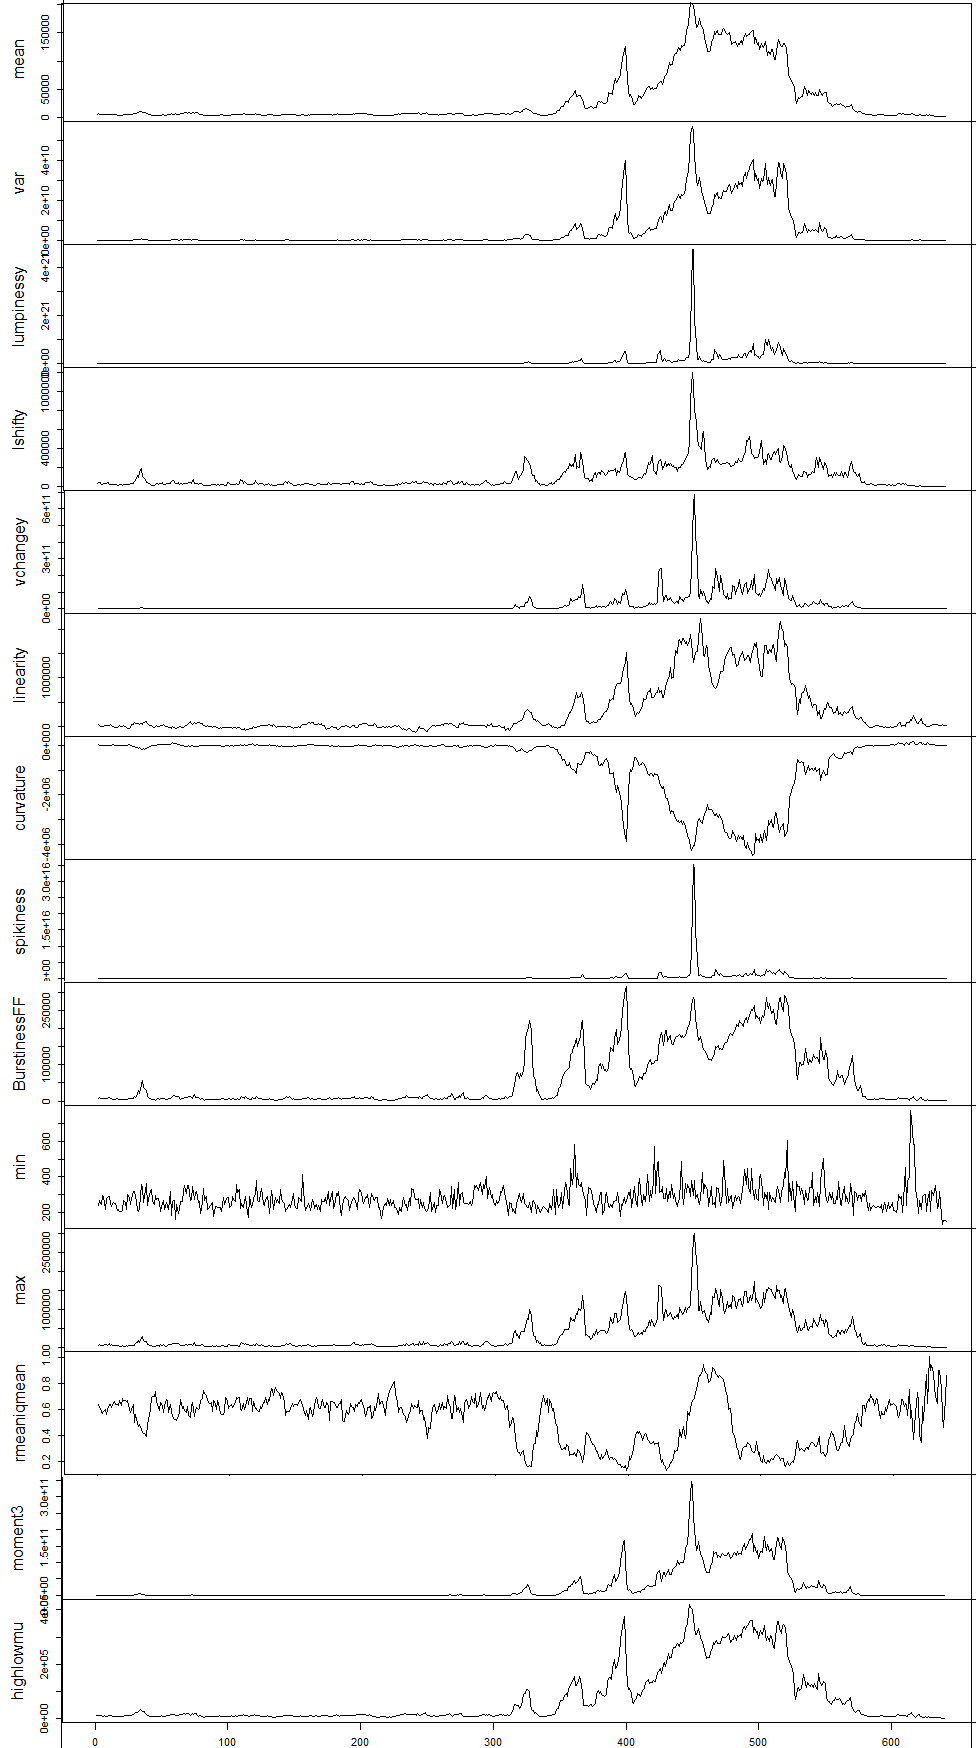
Feature Based Representation of Time series
Mean
Variance
Changing variance in remainder
Level shift using rolling window
Variance change
Strength of linearity
Strength of curvature
Strength of spikiness
Burstiness of time series (Fano Factor)
Minimum
Maximum
The ratio between interquartile mean and the arithmetic mean
Moment
Ratio of means of data that is below and upper the global mean
Feature Based Representation of Time series
Dimension Reduction for Time Series
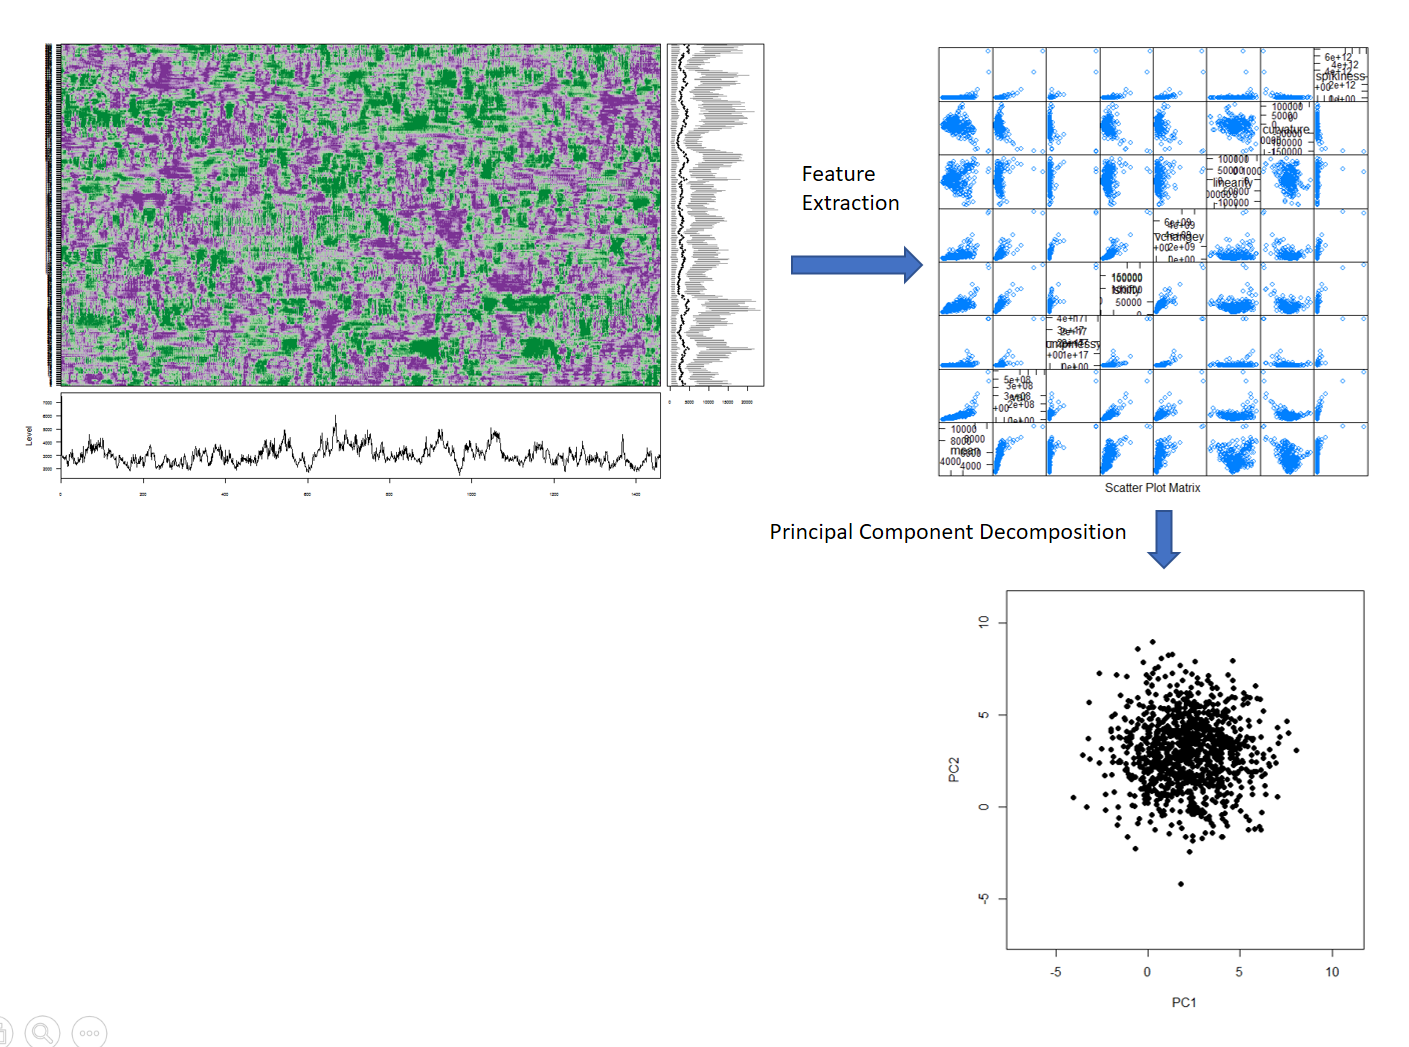
- First two PCs explain 85% of variation
Classical Extreme Value Theory
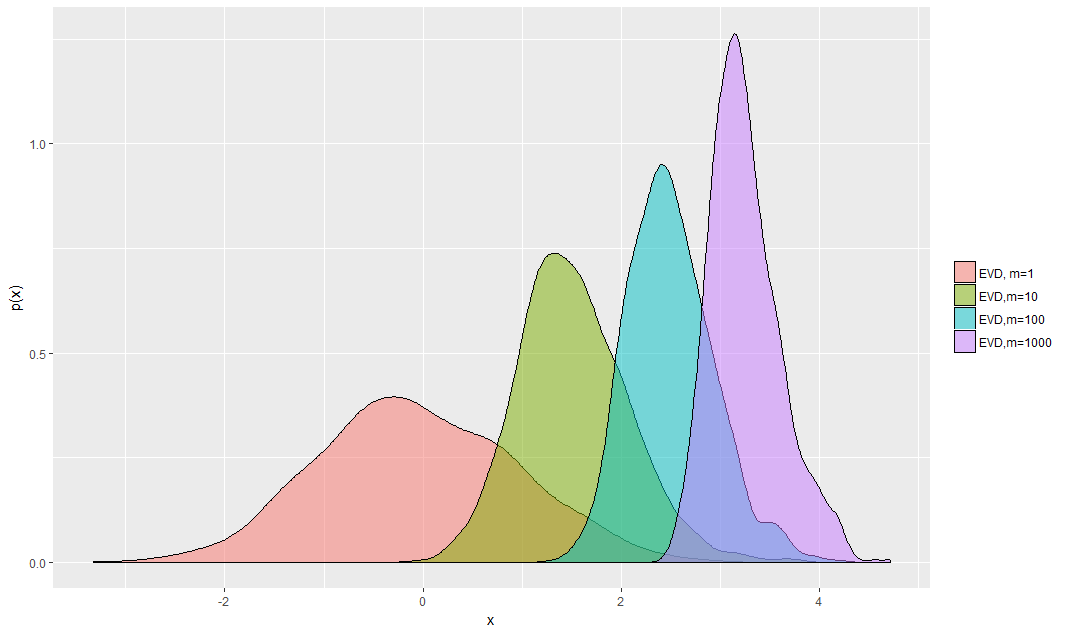
Figure: Extreme value distributions corresponding to m = 1; 10; 100; 1000, each describing where the maximum of m samples drawn from N(0; 1) will lie.
Theorem 1: Fisher-Tippett theorem (Limit laws for maxima)
(Embrechts et al. (2013), p. 121)
Let X=X1,X2,...,Xm be a sequence of independent and identically distributed random variables and Xmax=max(X). If there exist centering constant dm(∈R) and normalizing constant cm(>0), and some non-degenerate distribution function H+ such that

then H+ belongs to one of the following three distribution functions:

Extreme Value Distribution of the Probability Density Values (Clifton et al., 2011)
- Estimate the probability density function of the 2D PC space --> Kernel density estimation
- Draw a large number N of extremes from the estimated probability density function
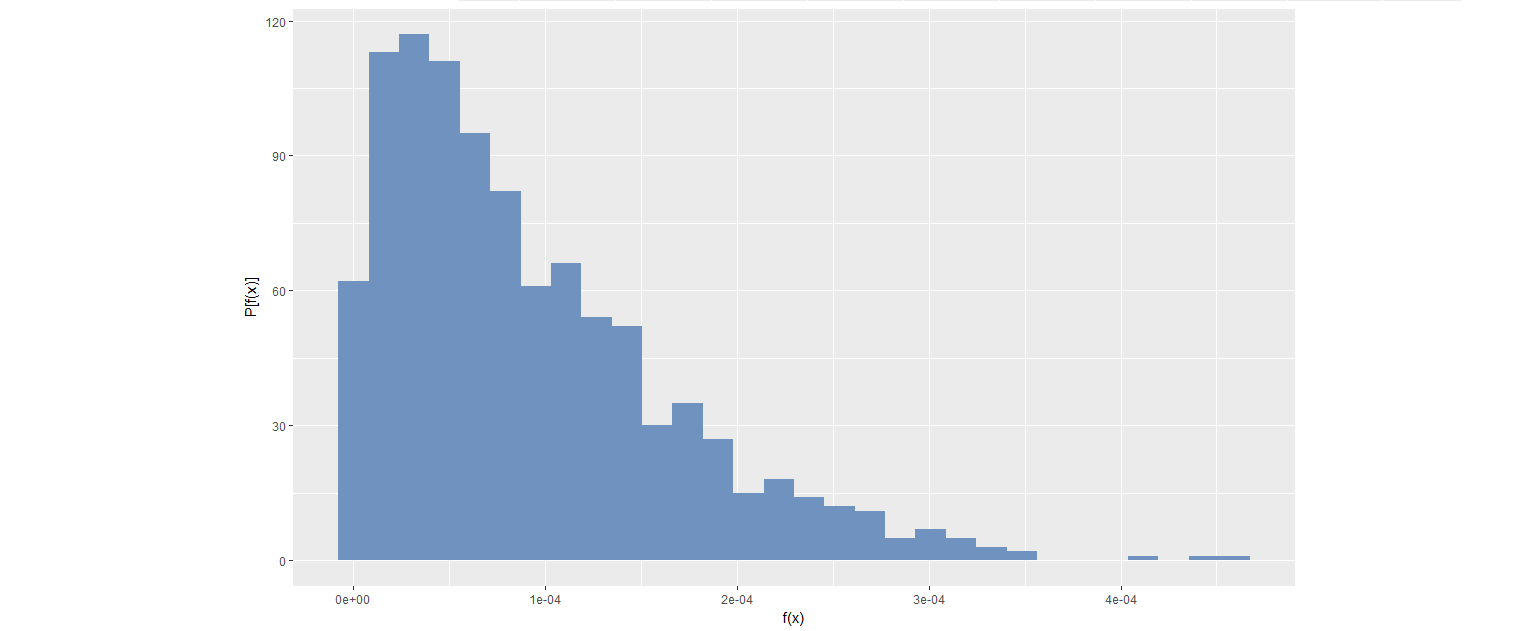
Figure: Distribution of 1000 extremes generated from bivariate kernel density function with m=500
Extreme Value Distribution of Probability Density Values (Clifton et al., 2011)
Define a
Ψ-transform space, using theΨ-transformation defined by
Ψ-transform maps the density values back into space into which a Gumbel distribution can be fitted.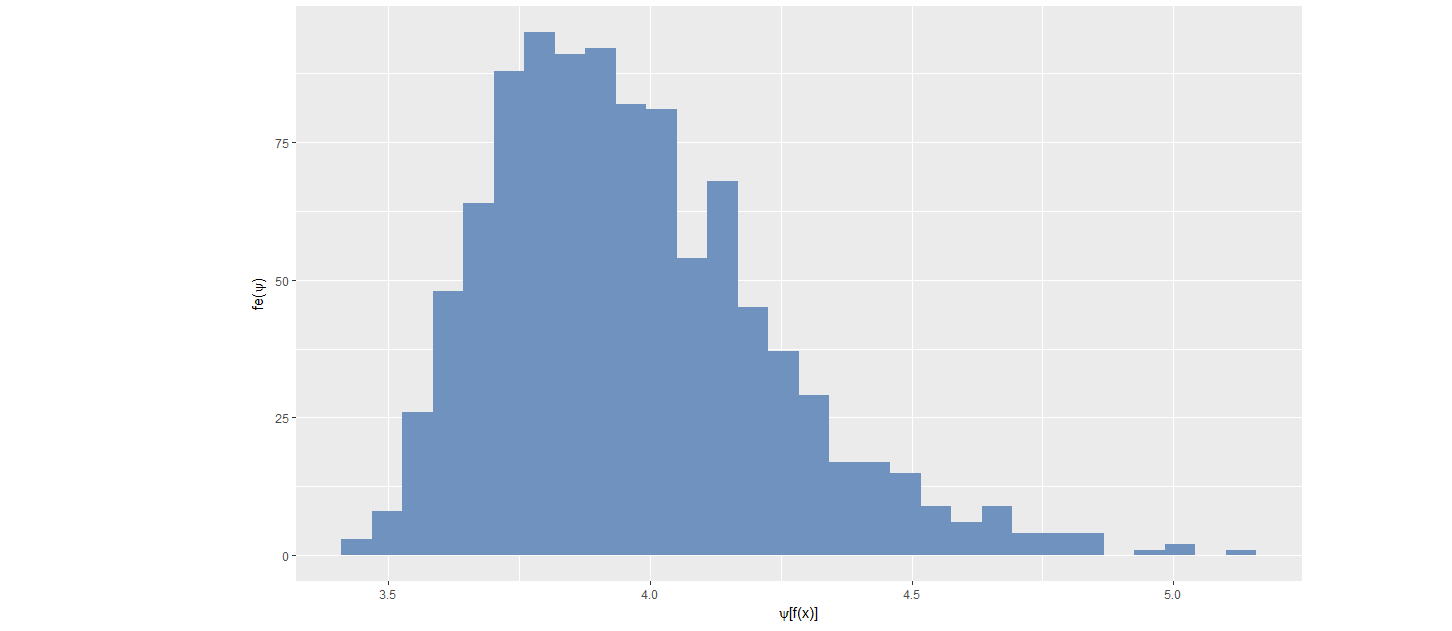
Figure: Distribution of transformed values

Image credit: Wikimedia Commons
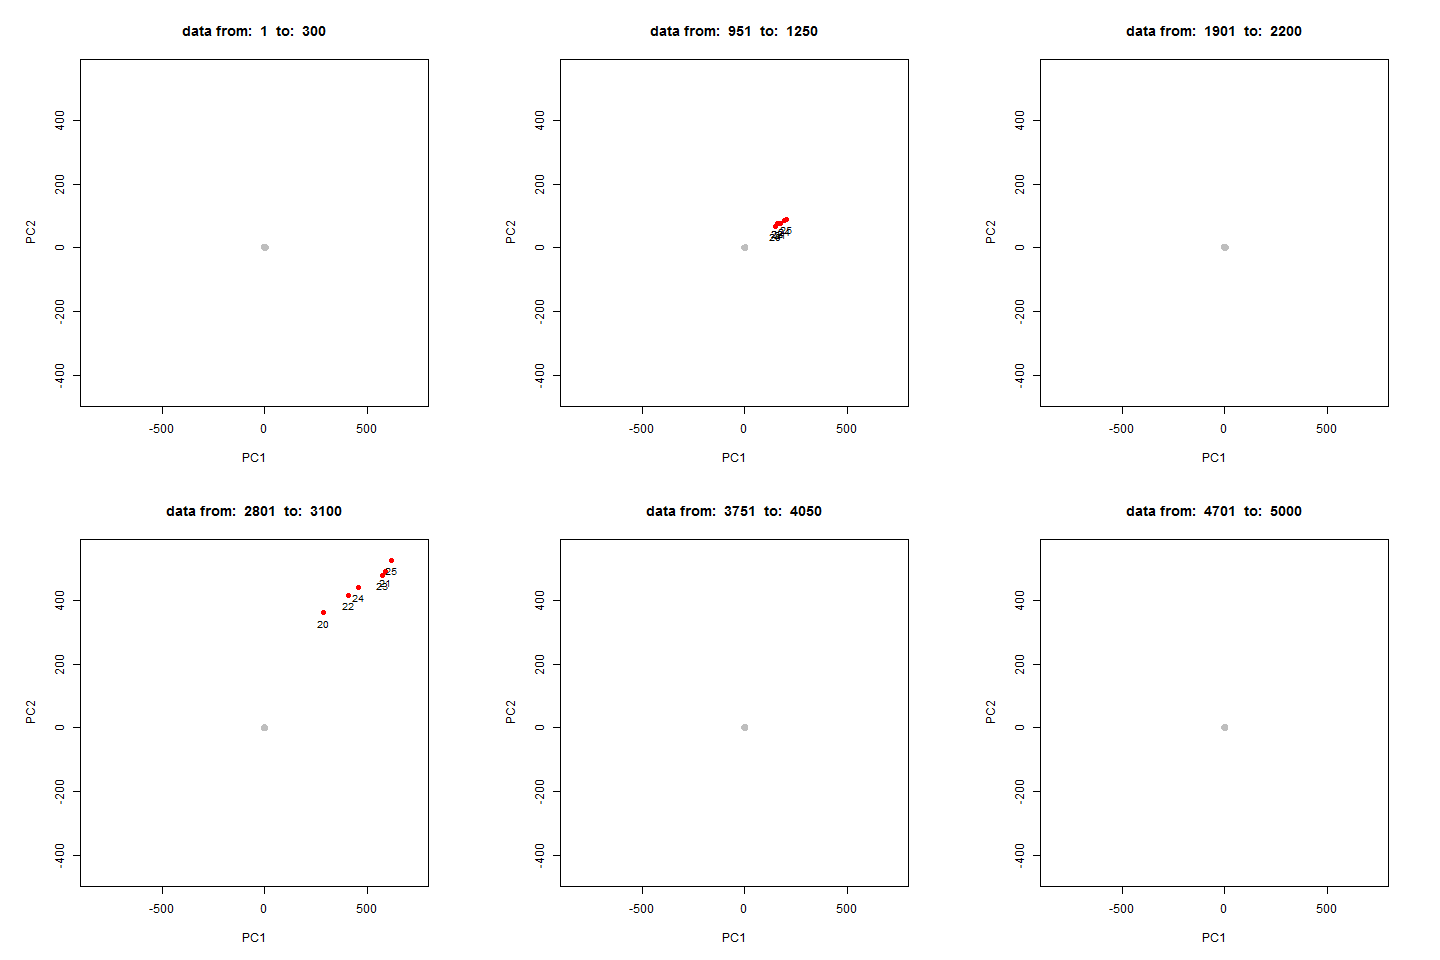
How it works?
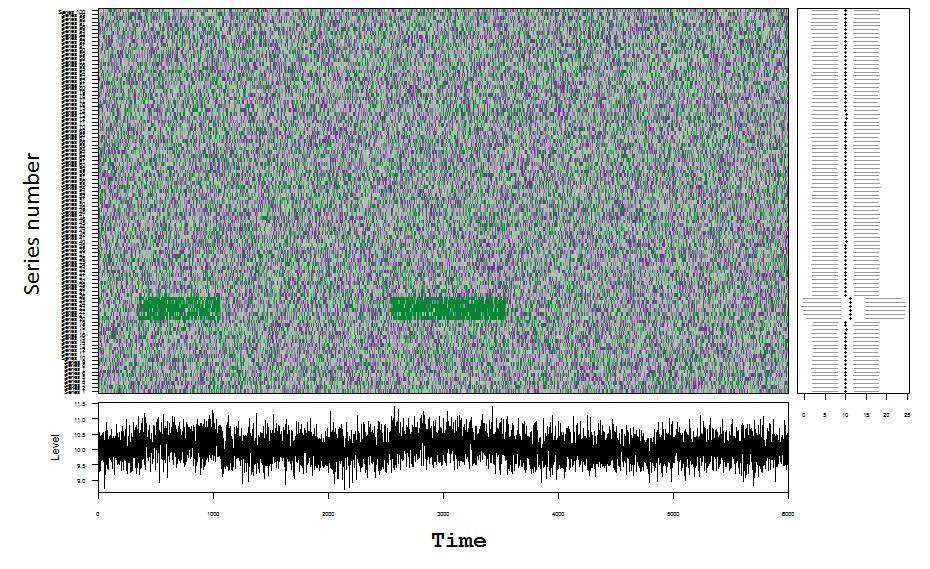
How it works?
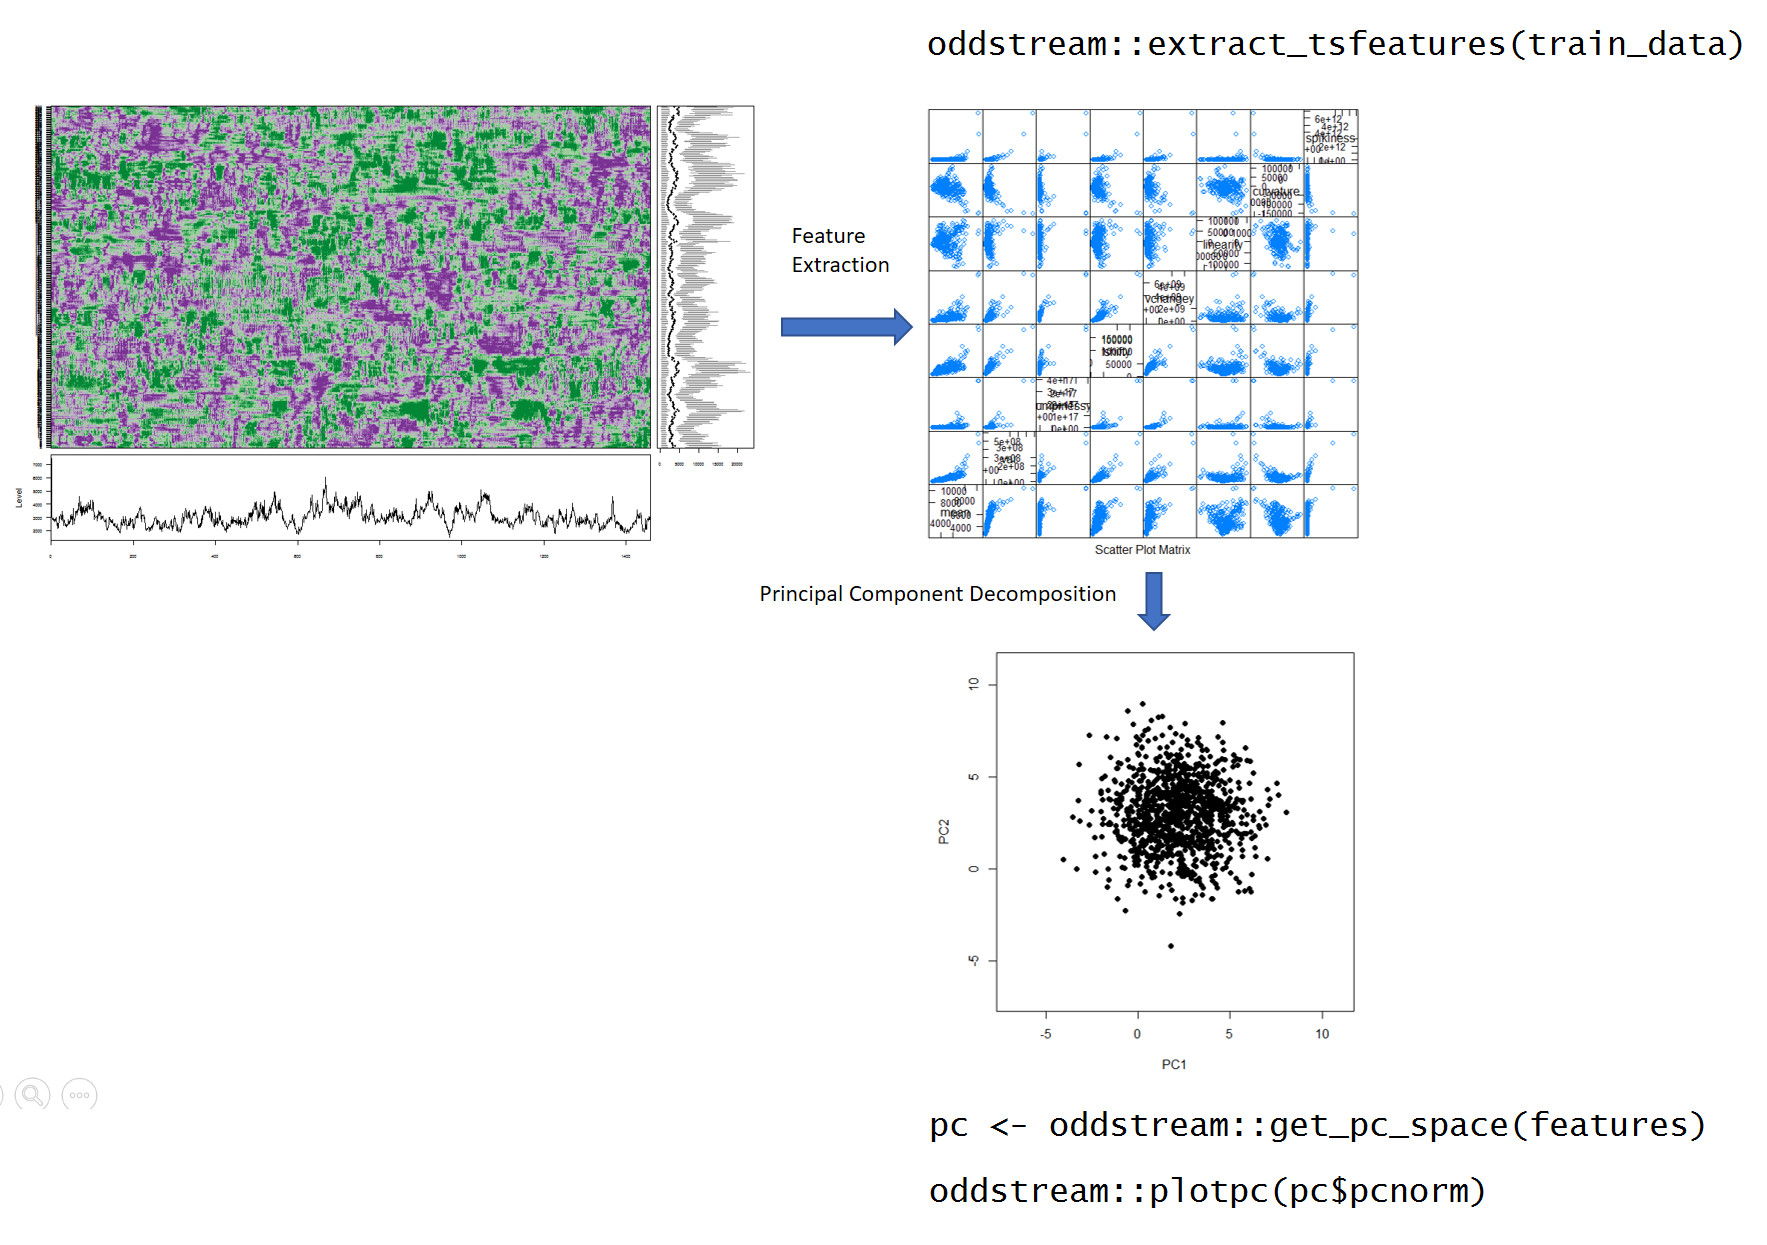
oddstream::find_odd_streams(train_data, test_stream)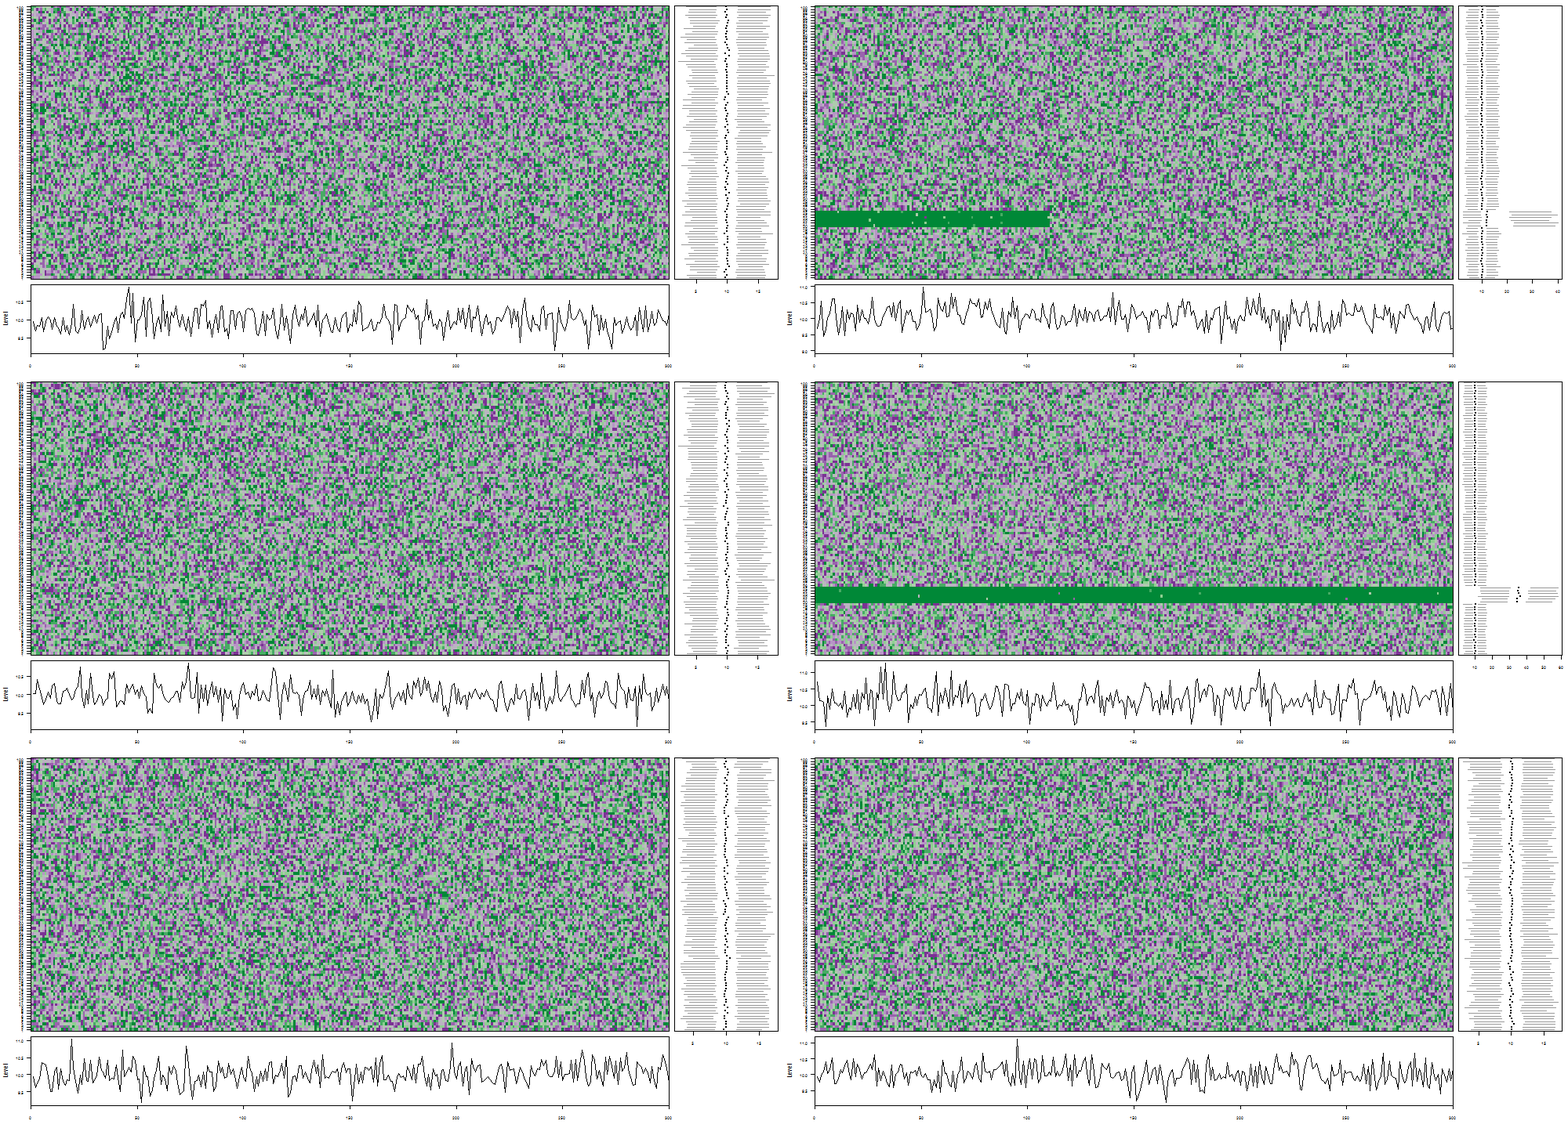
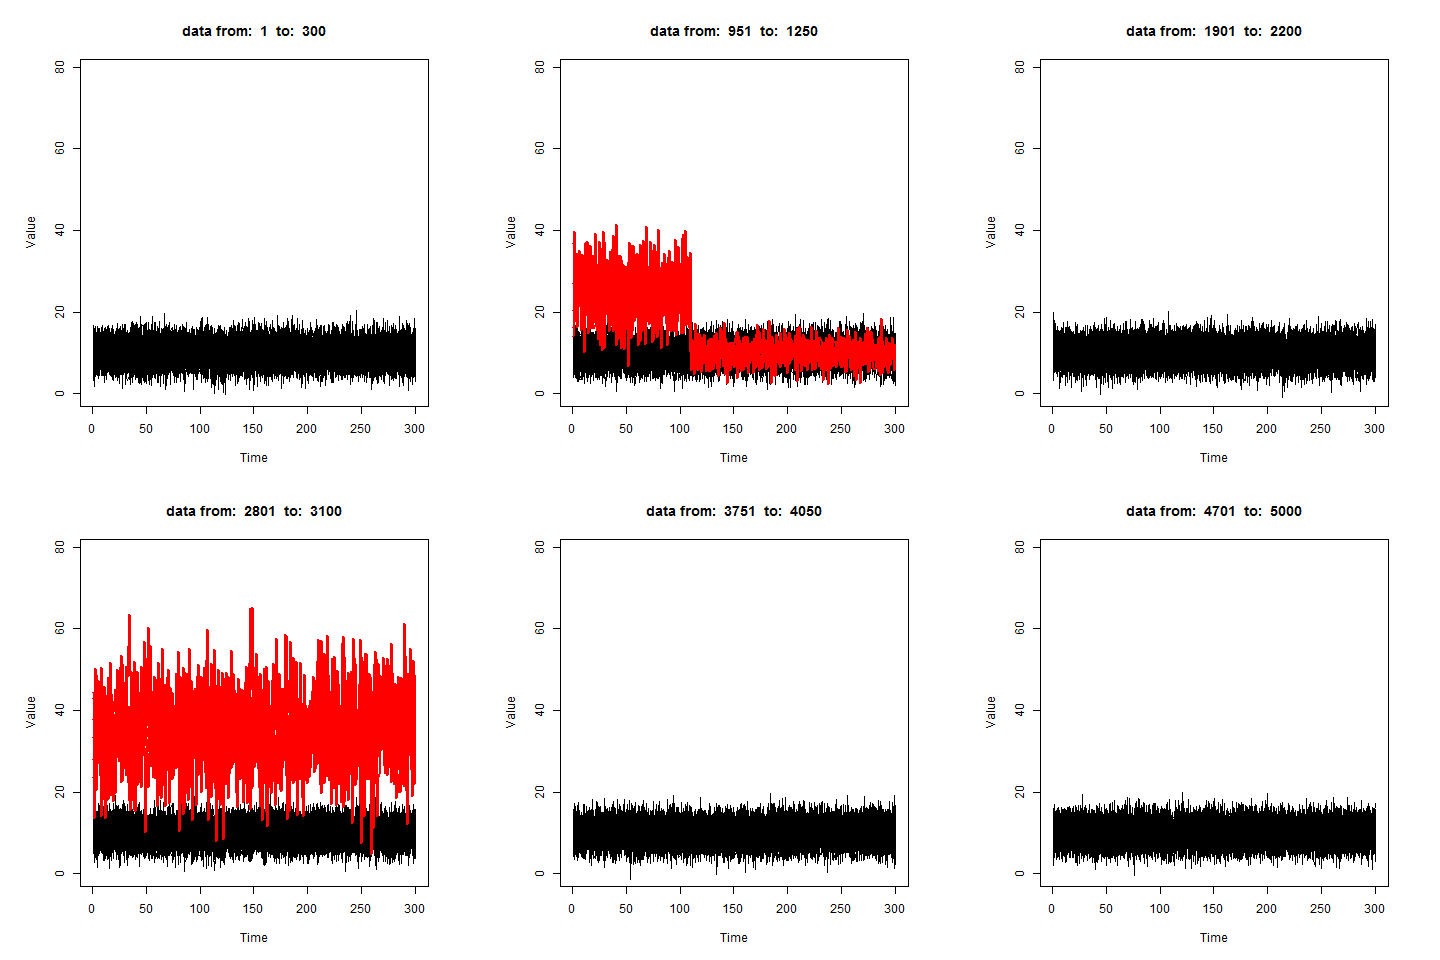
What Next?
- Explore more on feature extraction and feature selection methods to create a better feature space suitable for streaming data context.
What Next?
- Explore more on feature extraction and feature selection methods to create a better feature space suitable for streaming data context.
- Use other dimension reduction techniques such as multidimensional scaling analysis, random projection to see the effect on the performance of the proposed framework.
- Do more experiments on density estimation methods to get a better tail estimation.
- Extend the algorithm to work with Multidimensional Multivariate Data Streams.
References
Images were taken:
- https://fibersensys.com/cache/mod_roksprocket/4d90594c170e9ec140017f07 19ce2c98_350_900.jpg
- http://55ca7cd0-f8ac-0132-1185-705681baa5c1.s3-website-sa-east-1.amazonaws.com/defesanet/site/upload/news_image/2016/03/30157.jpg
- https://www.intel.co.uk/content/dam/www/public/emea/xe/en/images/it-managers/datacenter-corridor-16x9.jpg.rendition.intel.web.1280.720.jpg
- https://c1.staticflickr.com/8/7065/26946304530_cb30c23660_b.jpg
Main references
Clifton, D. A., Hugueny, S., & Tarassenko, L. (2011). Novelty detection with multivariate extreme value statistics. Journal of signal processing systems, 65 (3), (pp. 371-389).
Fulcher, B. D. (2012). Highly comparative time-series analysis. PhD thesis, University of Oxford.
Hyndman, R. J., Wang, E., & Laptev, N. (2015). Large-scale unusual time series detection. In 2015 IEEE International Conference on Data Mining Workshop (ICDMW), (pp. 1616-1619). IEEE.