Tidy Time Series Anomaly Detection for Load Forecasting
Priyanga Dilini Talagala
41st International Symposium on Forecasting
30.07.2021
1
Image credit: picxbay
2
3
Tidy forecasting workflow (Hyndman & Athanasopoulos, 2021)

4
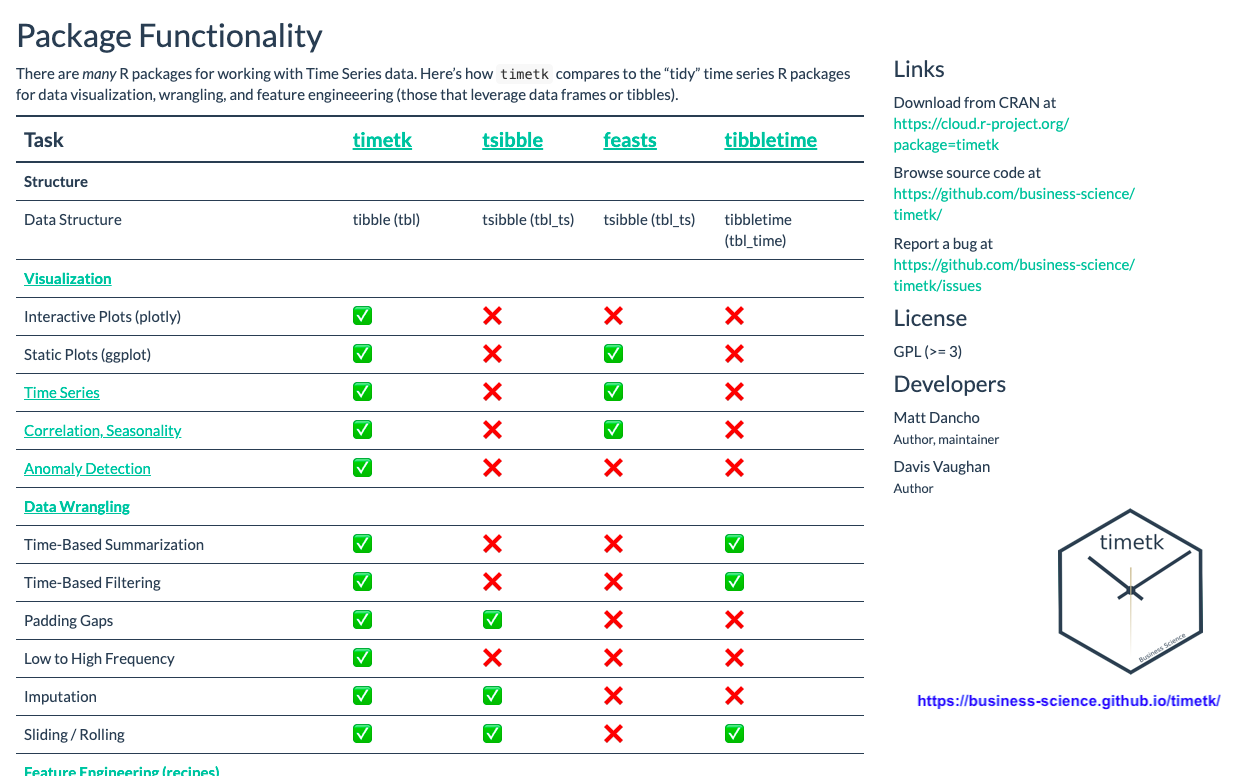
Tidy Time Series Anomaly Detection
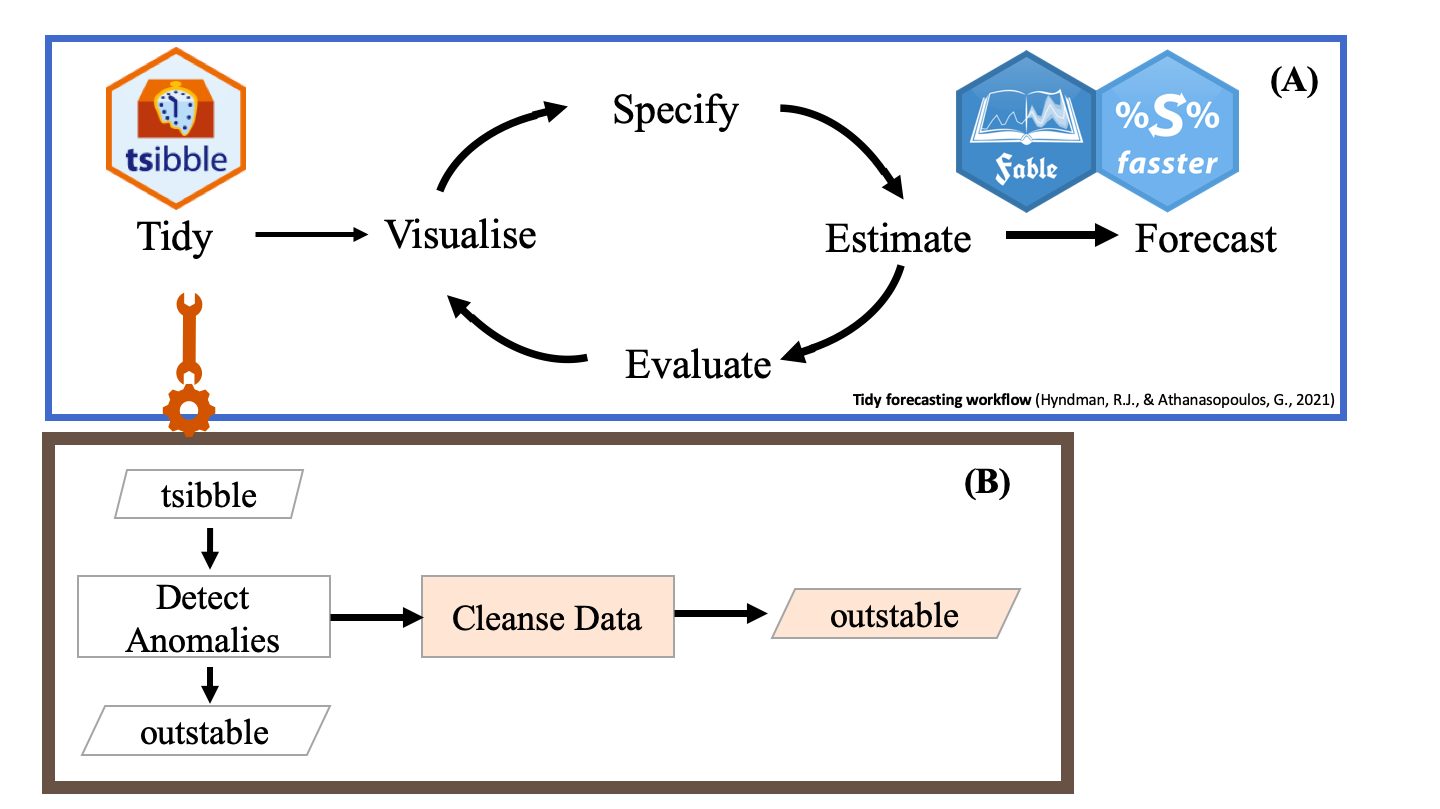
5
outstable
TABLE of OUTliers in Time Series Data

devtools::install_github("pridiltal/outstable")
6
outstable
TABLE of OUTliers in Time Series Data

7
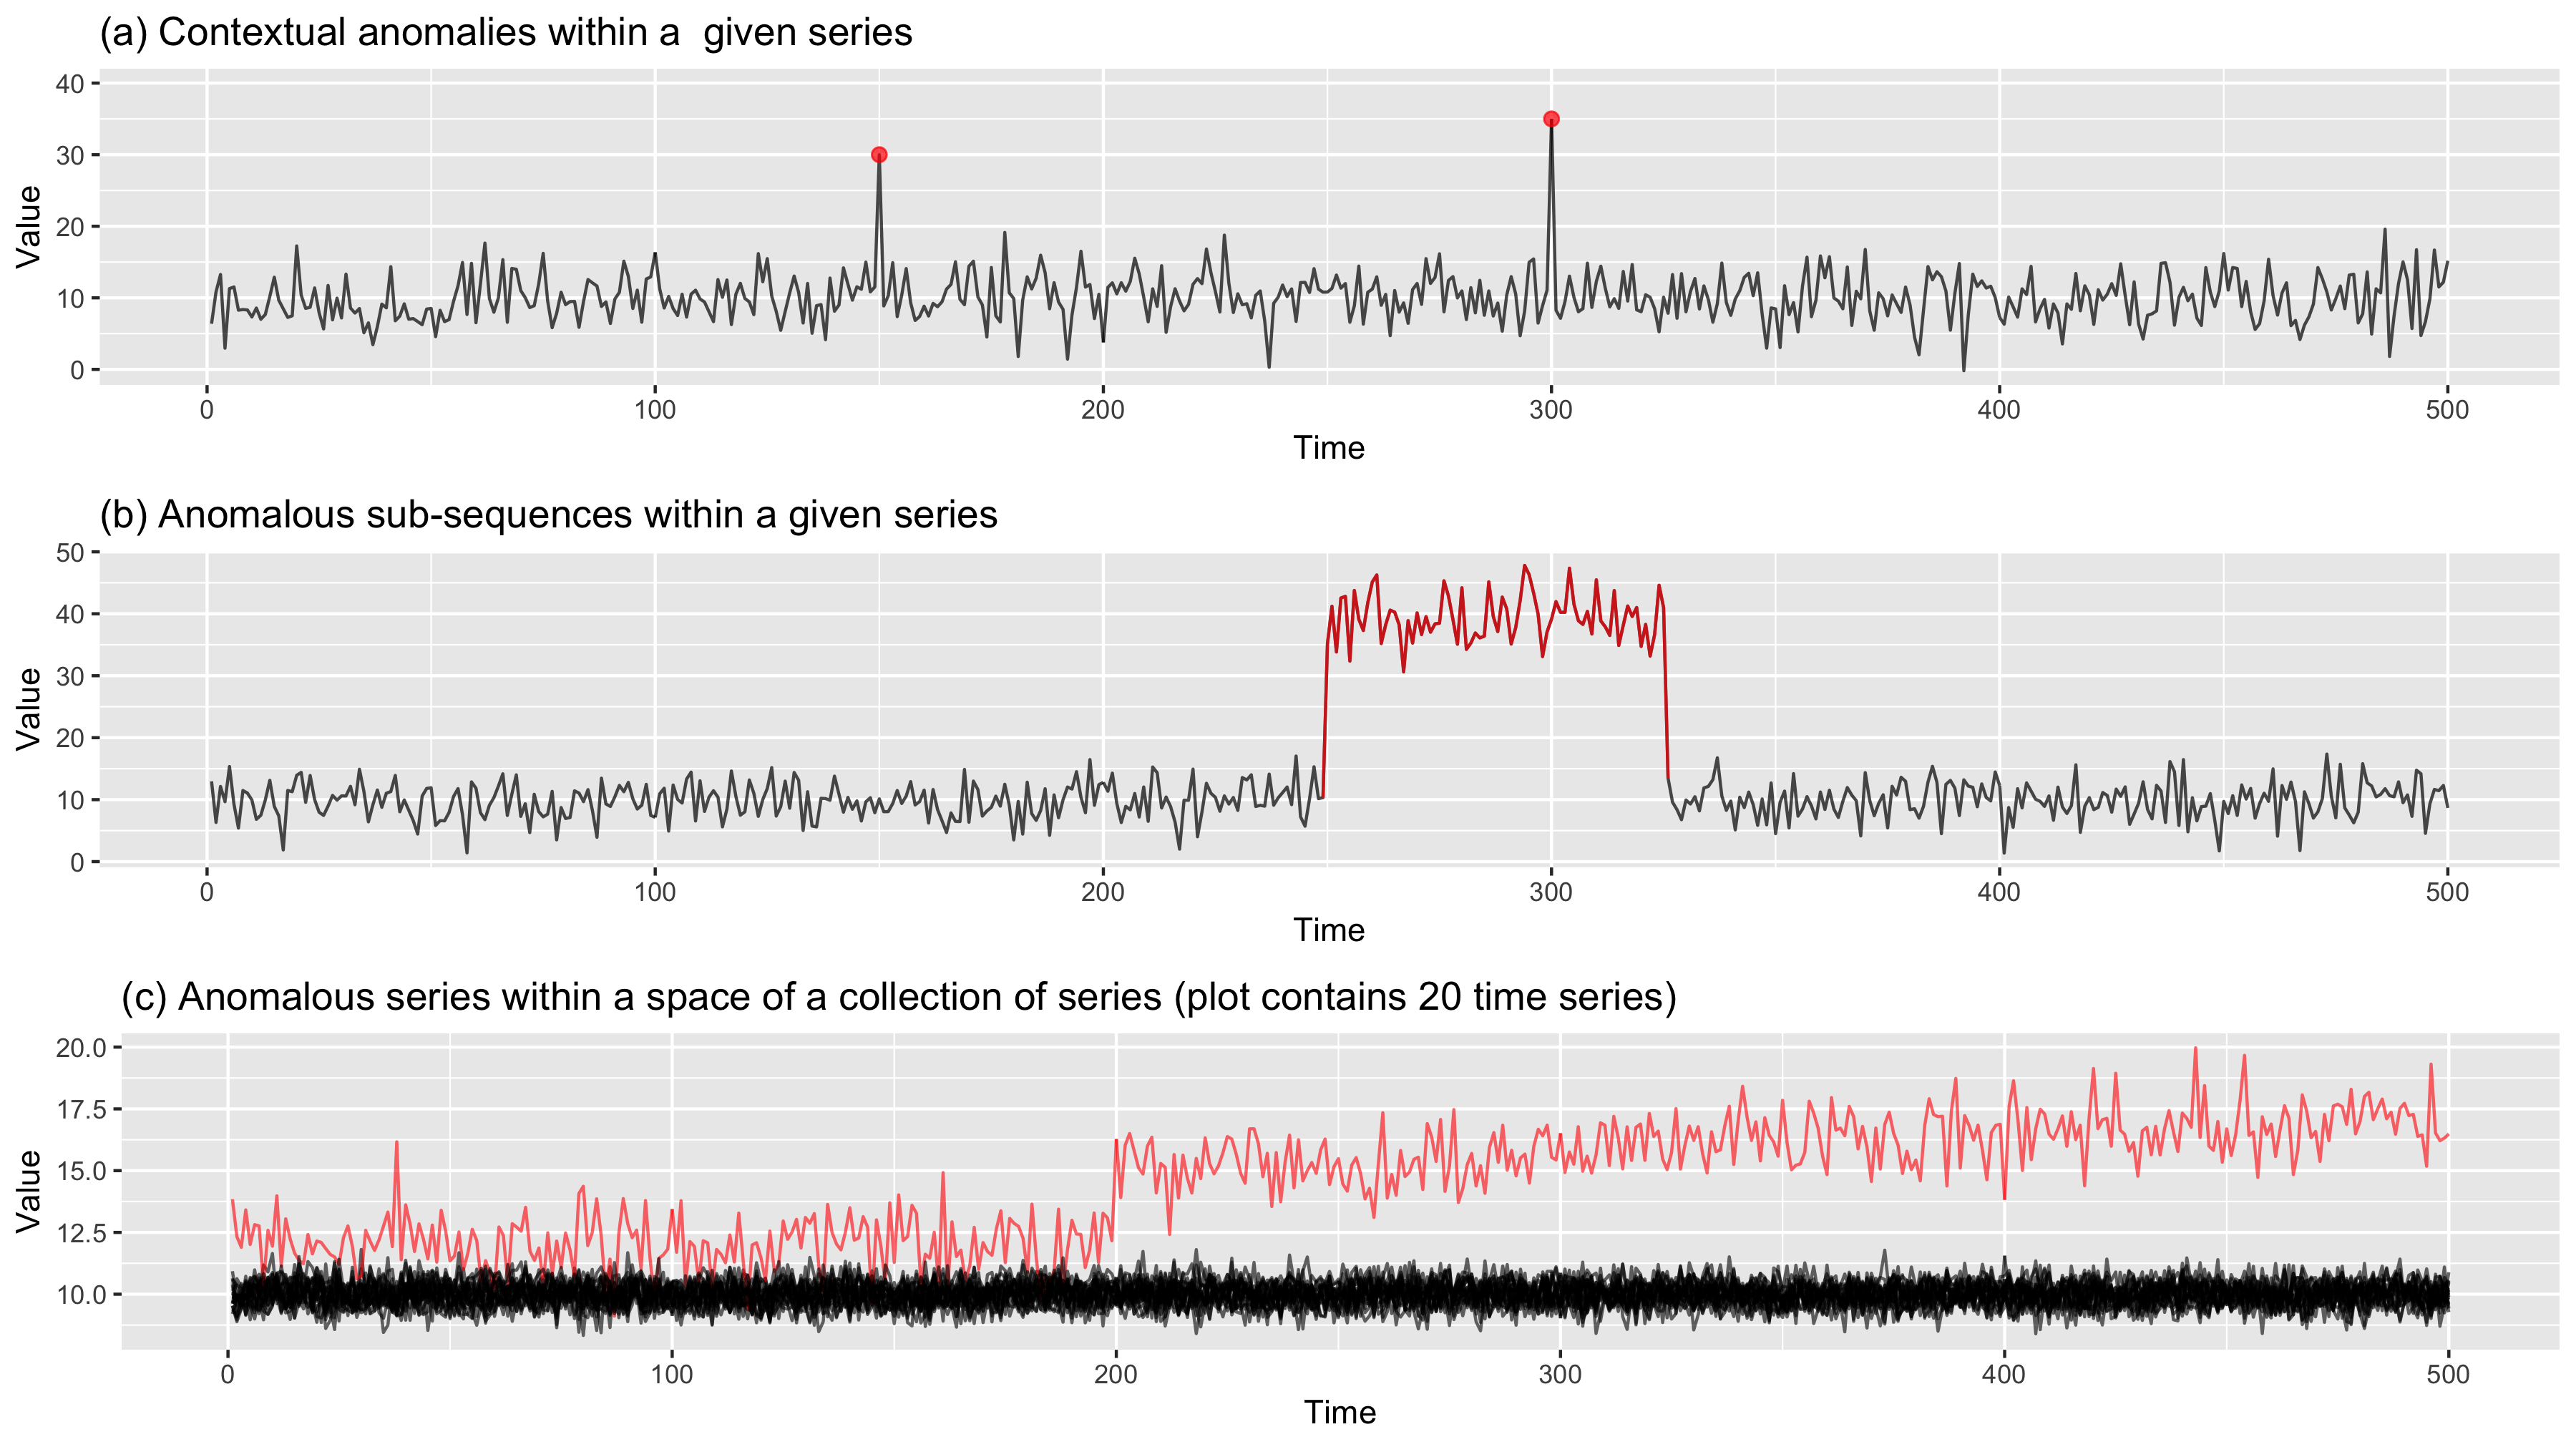
Outliers in Time Series Data
8
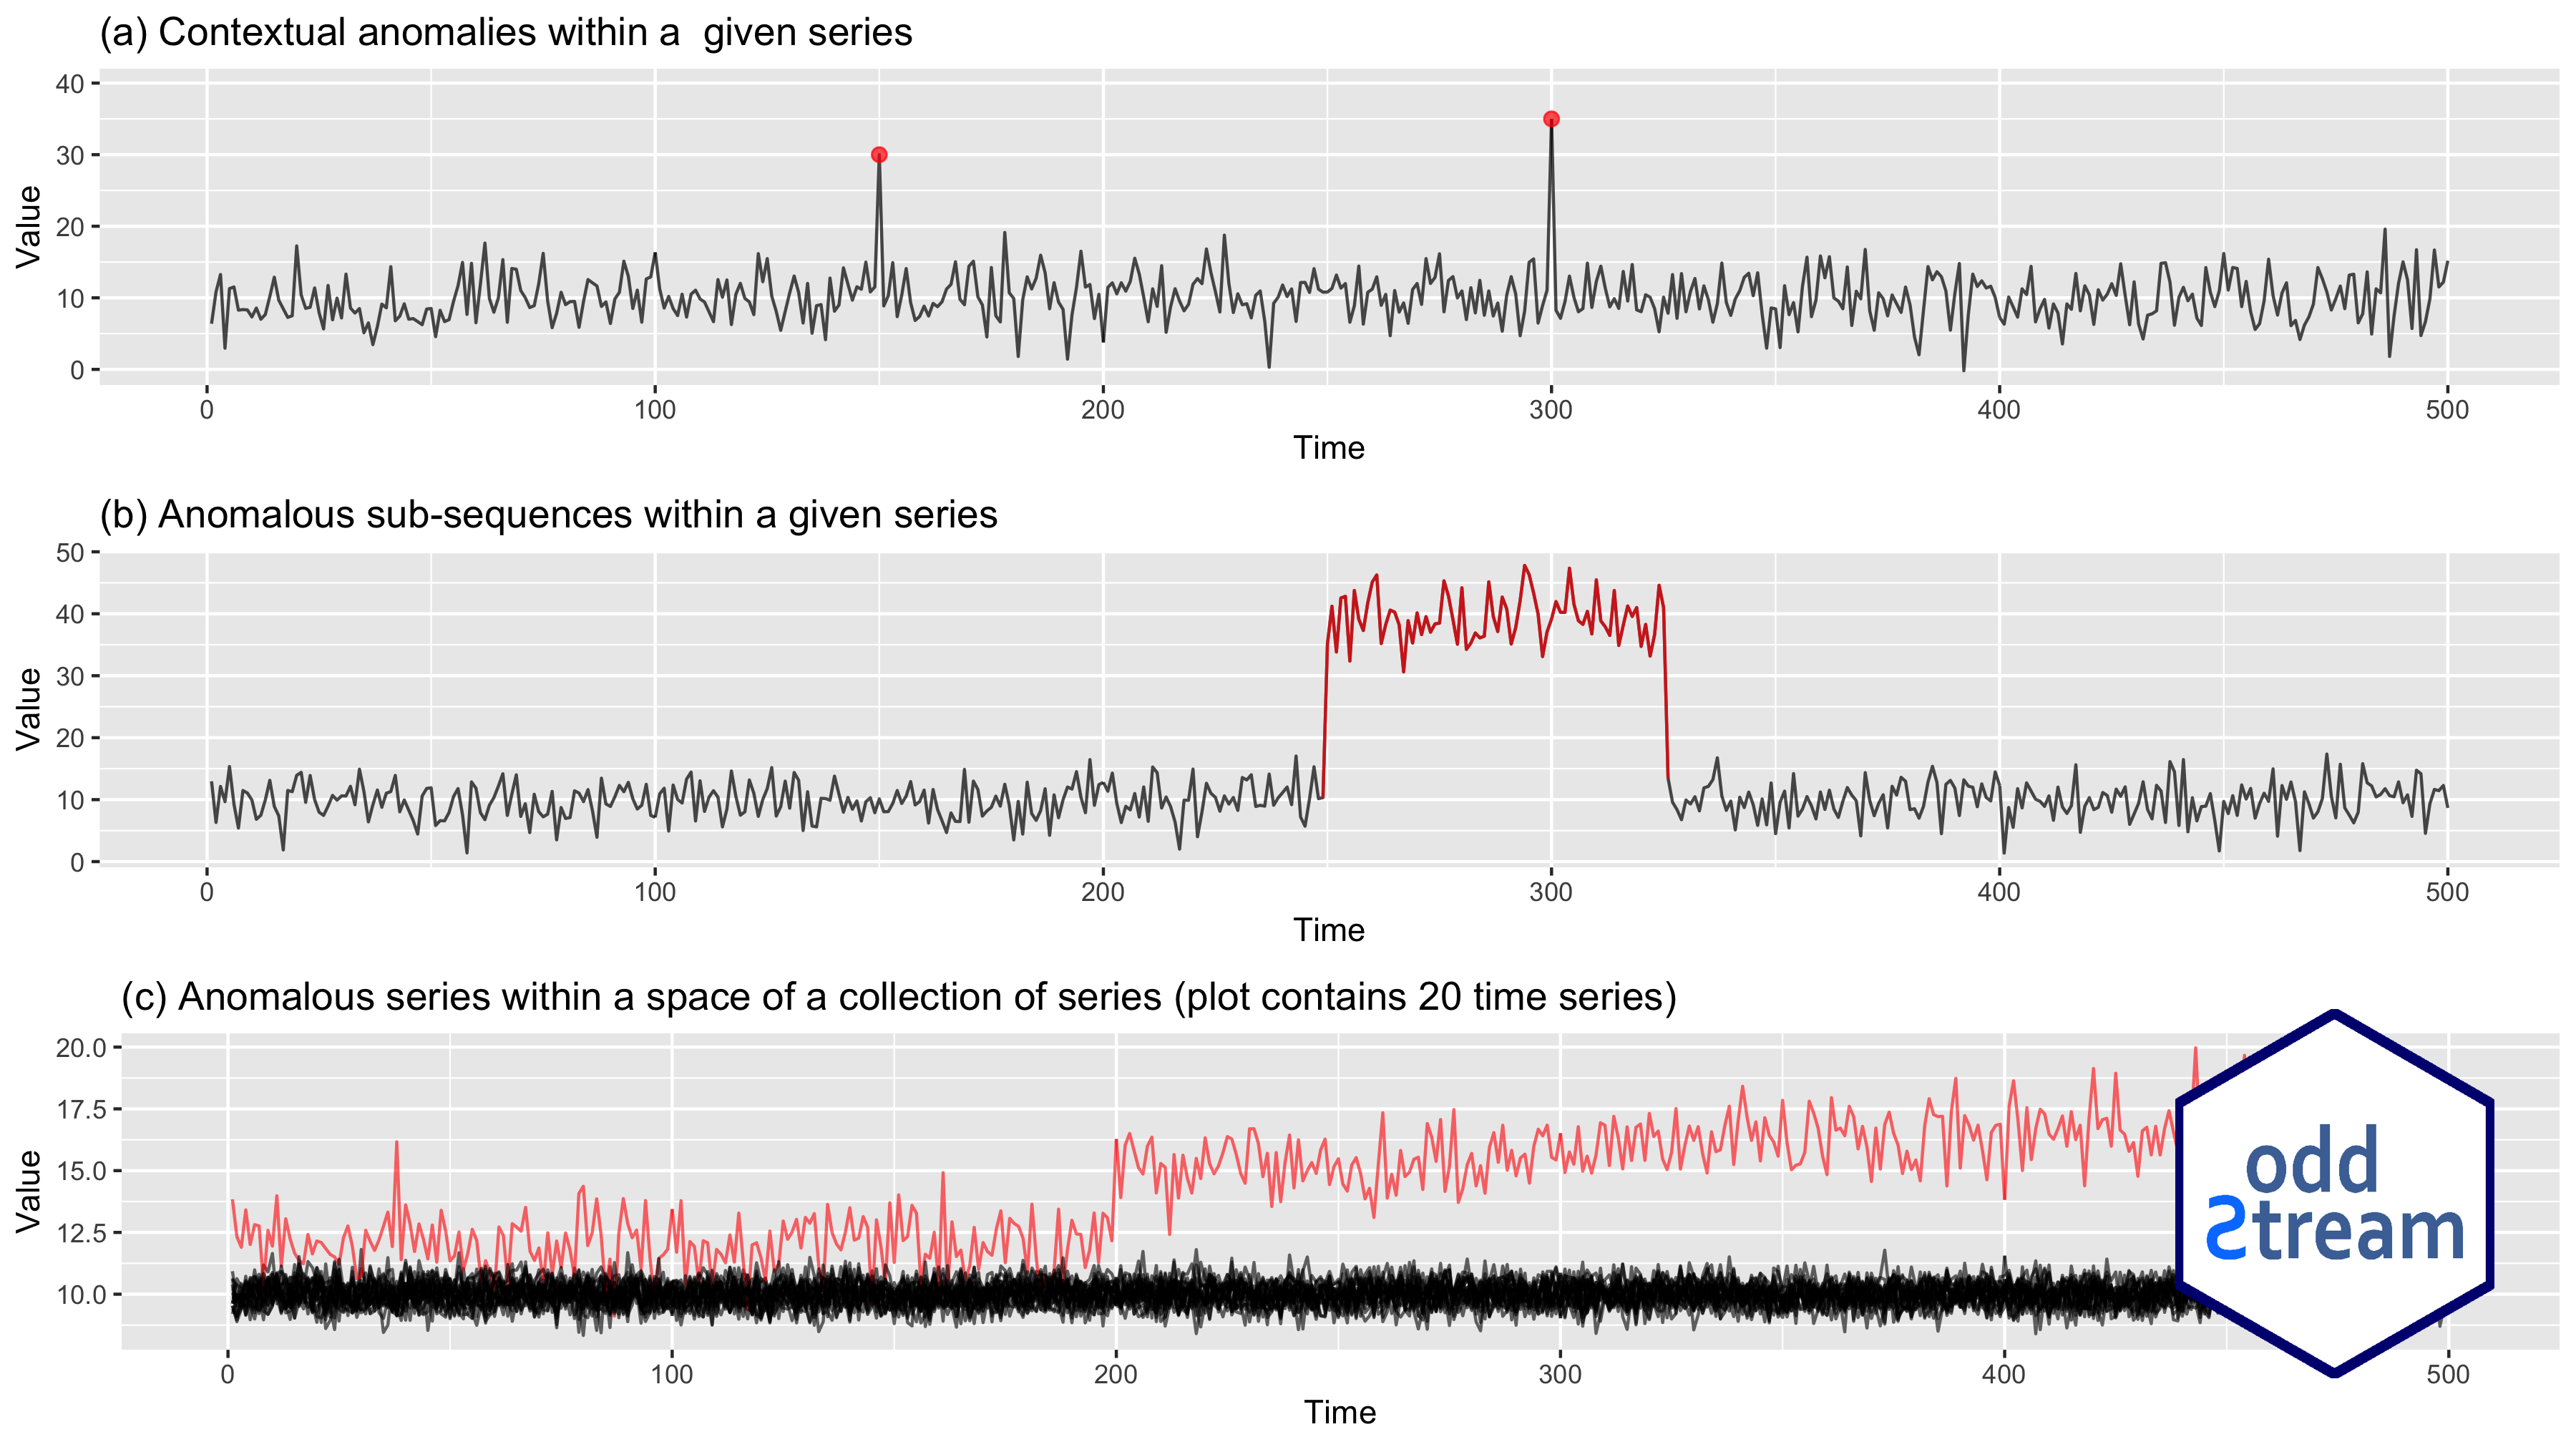
Outliers in Time Series Data
9
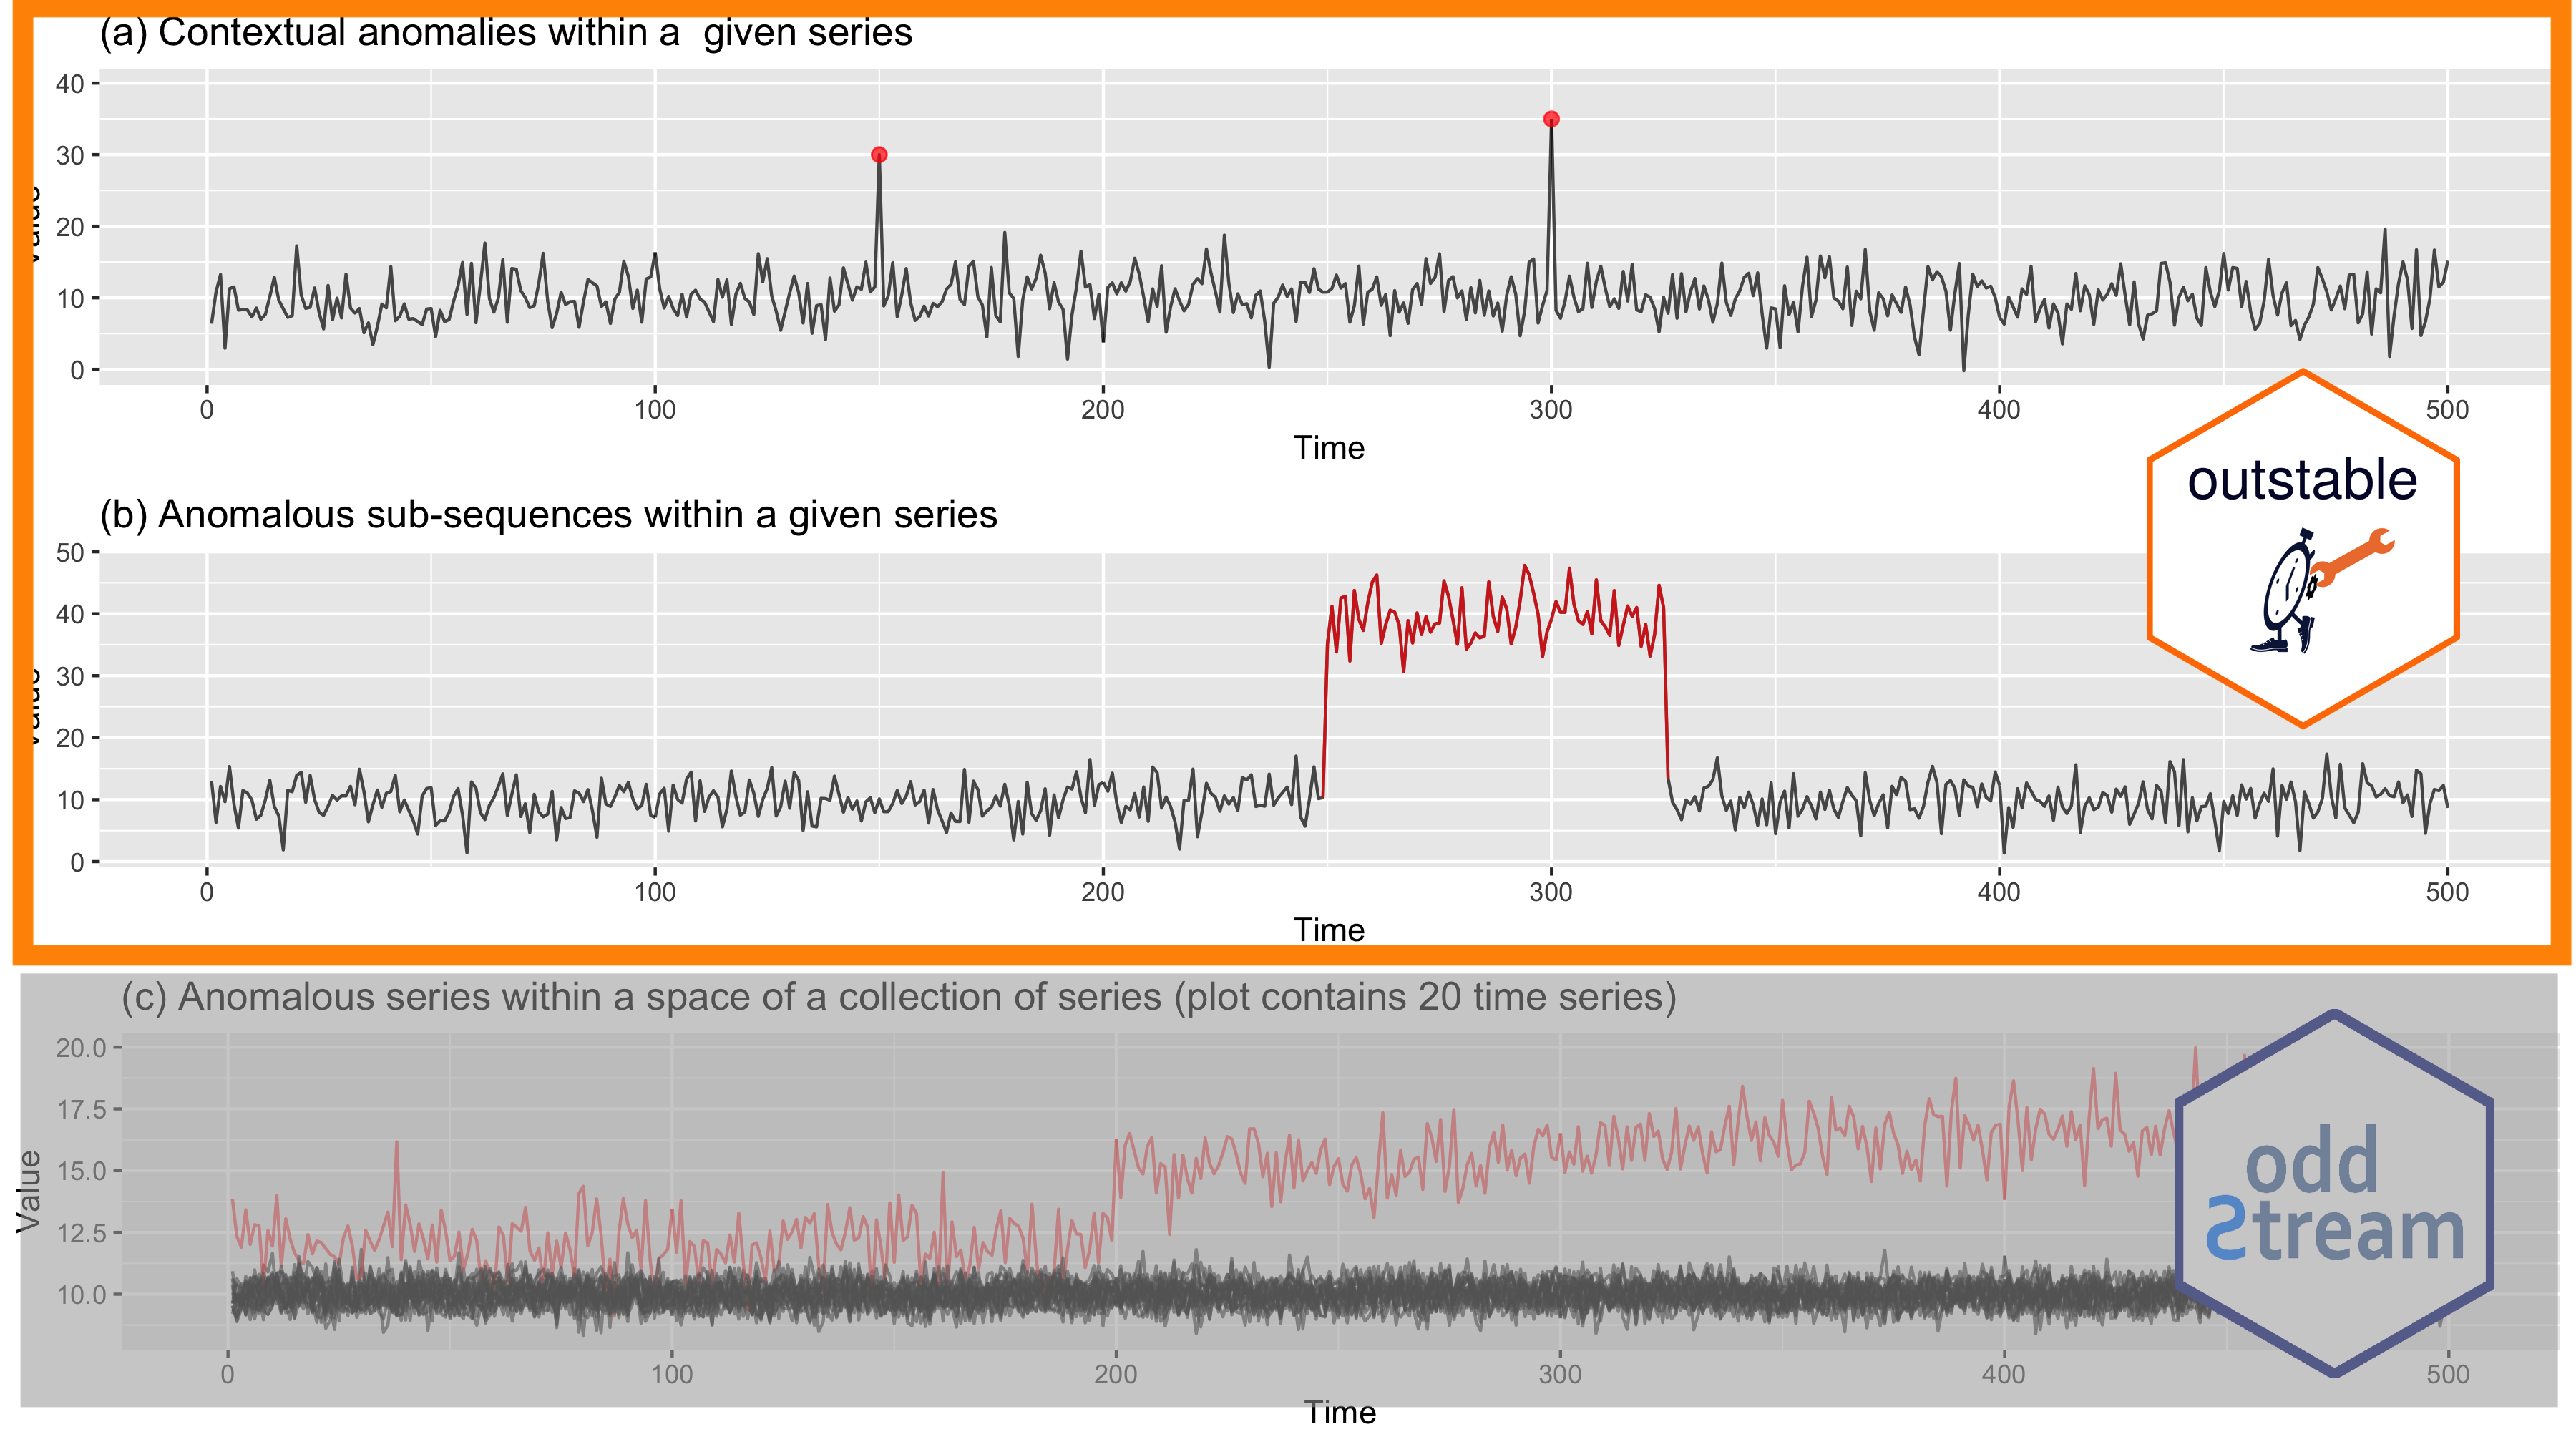
Outliers in Time Series Data
10
Outlier Detection in Time Series Data
Main contributions
- This work develops a framework for detecting outliers in tidy time series data.
11
Outlier Detection in Time Series Data
Main contributions
- This work develops a framework for detecting outliers in tidy time series data.
- The algorithm works with tidy temporal data provided by the
tsibblepackage and produces anoutstable, a tsibble with flagged anomalies and their degree of outlierness.
11
Outlier Detection in Time Series Data
Main contributions
- This work develops a framework for detecting outliers in tidy time series data.
- The algorithm works with tidy temporal data provided by the
tsibblepackage and produces anoutstable, a tsibble with flagged anomalies and their degree of outlierness. - The proposed framework can also provide a cleansed tsibble that closely integrates with the tidy forecasting workflow used in the
tidyvertstoolbox.
11
Outlier Detection in Time Series Data
Main contributions
- This work develops a framework for detecting outliers in tidy time series data.
- The algorithm works with tidy temporal data provided by the
tsibblepackage and produces anoutstable, a tsibble with flagged anomalies and their degree of outlierness. - The proposed framework can also provide a cleansed tsibble that closely integrates with the tidy forecasting workflow used in the
tidyvertstoolbox. - Data driven outlier threshold with a valid probabilistic interpretation
What is an outlier ?
- We define an outlier as an observation that is very unlikely given the forecast distribution.
- Outlier is a rare observation which has a very low chance of occurrence with respect to the typical behaviour of the time series.
11

12

13

Forecast combinations
- Use several different methods on the same time series, and average the resulting forecasts (Hyndman & Athanasopoulos, 2021)
13

Forecast combinations
- Use several different methods on the same time series, and average the resulting forecasts (Hyndman & Athanasopoulos, 2021)
- Dramatic performance improvements by simply averaging the forecasts (Clemen, 1989)
13

Forecast combinations
- Use several different methods on the same time series, and average the resulting forecasts (Hyndman & Athanasopoulos, 2021)
- Dramatic performance improvements by simply averaging the forecasts (Clemen, 1989)
- Combining forecasts often leads to better forecast accuracy (Bates & Granger, 1969)
13
Outstable
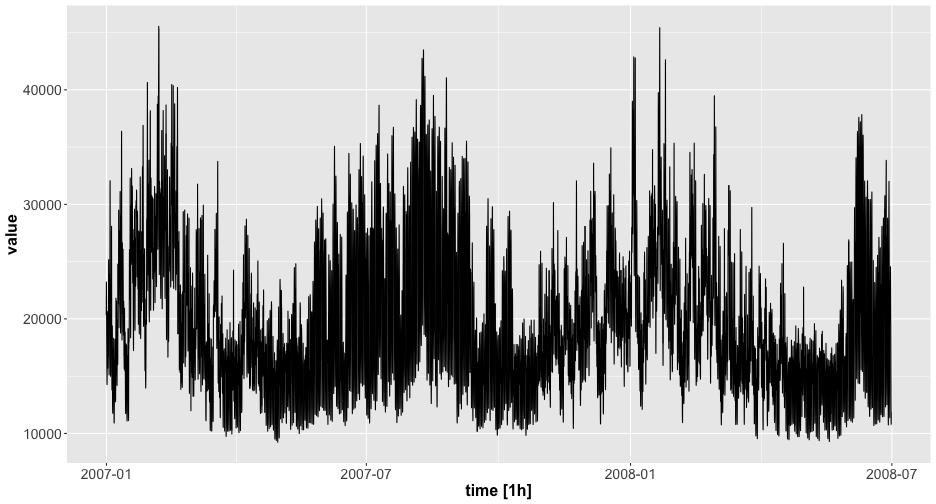
14
outstable
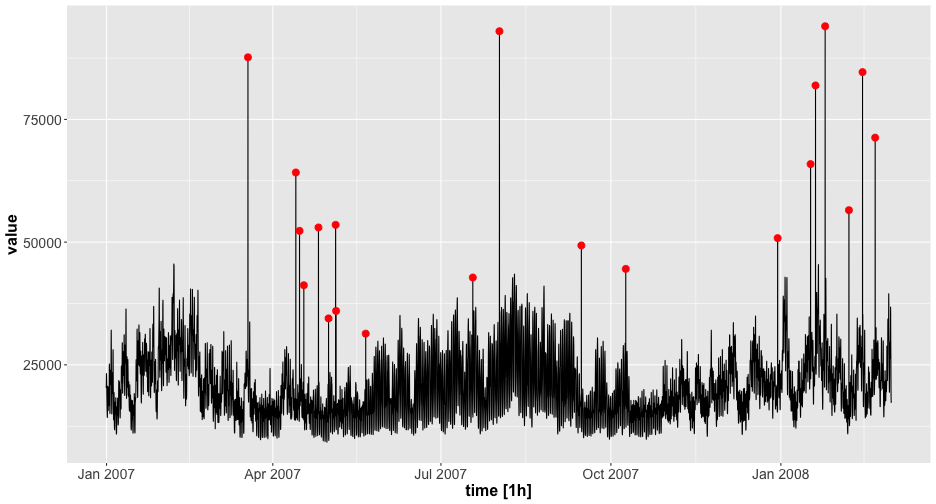
15
Outstable: Outlier Threshold Calculation

16
Outstable - Visualize residuals with true outlier

17
Anomalous threshold calculation
- Estimate the probability density function of the residual series ⟶ Kernel density estimation.
18
Anomalous threshold calculation
- Estimate the probability density function of the residual series ⟶ Kernel density estimation.
- Draw a large number N of extremes (argminx∈X[f(x)]) from the high density region of the estimated probability density function.
18
Anomalous threshold calculation
- Estimate the probability density function of the residual series ⟶ Kernel density estimation.
- Draw a large number N of extremes (argminx∈X[f(x)]) from the high density region of the estimated probability density function.
- Define a Ψ-transform space, using the Ψ-transformation defined by (Clifton et al., 2011)
Ψ[f2(x)]={(−2ln(f(x))−2ln(2π))1/2,f(x)<(2π)−10,f(x)≥(2π)−1.
- Ψ-transform maps the density values back into space into which a Gumbel distribution can be fitted.
- Fit a Gumbel distribution to the resulting Ψ[f(x)] values. The Gumbel parameter values are obtained via maximum likelihood estimation.
- Determine the anomalous threshold using the corresponding univariate CDF, Fe in the transformed Ψ-space.
- Density based, data driven anomalous threshold ⟶ extreme value theory
18
outstable:detect_outliers
# devtools::install_github(pridiltal/outstable)library(outstable)19
outstable:detect_outliers
# devtools::install_github(pridiltal/outstable)library(outstable) data %>% tsibble::as_tsibble(index = time)## # A tsibble: 13,124 x 2 [1h] <UTC>## time value## <dttm> <dbl>## 1 2006-12-31 19:00:00 20601## 2 2006-12-31 20:00:00 20377## 3 2006-12-31 21:00:00 20745## 4 2006-12-31 22:00:00 21648## 5 2006-12-31 23:00:00 23220## 6 2007-01-01 00:00:00 22846## 7 2007-01-01 01:00:00 21856## 8 2007-01-01 02:00:00 20912## 9 2007-01-01 03:00:00 20005## 10 2007-01-01 04:00:00 18592## # … with 13,114 more rows20
outstable:detect_outliers
# devtools::install_github(pridiltal/outstable)library(outstable) data %>% tsibble::as_tsibble(index = time) %>% outstable::detect_outliers( variable = "value", cmbn_model = c("lm", "theta","fasster"), p_rate = 0.01)## # A tsibble: 13,124 x 4 [1h] <UTC>## time value .outscore .outtype## <dttm> <dbl> <dbl> <fct> ## 1 2006-12-31 19:00:00 20601 0.146 typical ## 2 2006-12-31 20:00:00 20377 0.0727 typical ## 3 2006-12-31 21:00:00 20745 0.175 typical ## 4 2006-12-31 22:00:00 21648 0.276 typical ## 5 2006-12-31 23:00:00 23220 0.482 typical ## 6 2007-01-01 00:00:00 22846 0.332 typical ## 7 2007-01-01 01:00:00 21856 0.286 typical ## 8 2007-01-01 02:00:00 20912 0.307 typical ## 9 2007-01-01 03:00:00 20005 0.333 typical ## 10 2007-01-01 04:00:00 18592 0.228 typical ## # … with 13,114 more rows21
outstable::cleanse_data()
# devtools::install_github(pridiltal/outstable)library(outstable) data %>% tsibble::as_tsibble(index = time) %>% outstable::detect_outliers( variable = "value", cmbn_model = c("lm", "theta","fasster"), p_rate = 0.01) %>% outstable::cleanse_data( variable = "value", impute = "linear")## # A tsibble: 13,124 x 5 [1h] <UTC>## time value .outscore .outtype .altered## <dttm> <dbl> <dbl> <fct> <dbl>## 1 2006-12-31 19:00:00 20601 0.146 typical 20601## 2 2006-12-31 20:00:00 20377 0.0727 typical 20377## 3 2006-12-31 21:00:00 20745 0.175 typical 20745## 4 2006-12-31 22:00:00 21648 0.276 typical 21648## 5 2006-12-31 23:00:00 23220 0.482 typical 23220## 6 2007-01-01 00:00:00 22846 0.332 typical 22846## 7 2007-01-01 01:00:00 21856 0.286 typical 21856## 8 2007-01-01 02:00:00 20912 0.307 typical 20912## 9 2007-01-01 03:00:00 20005 0.333 typical 20005## 10 2007-01-01 04:00:00 18592 0.228 typical 18592## # … with 13,114 more rows22
tidyverts: Tidy tools for time series
# devtools::install_github(pridiltal/outstable)library(outstable) data %>% tsibble::as_tsibble(index = time) %>% outstable::detect_outliers( variable = "value", cmbn_model = c("lm", "theta","fasster"), p_rate = 0.01) %>% outstable::cleanse_data( variable = "value", impute = "linear") %>% fabletools::autoplot(.altered)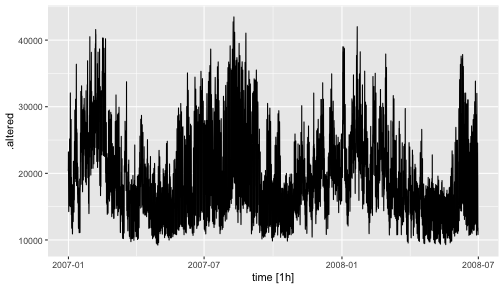
23
tidyverts: Tidy tools for time series
# devtools::install_github(pridiltal/outstable)library(outstable) data %>% tsibble::as_tsibble(index = time) %>% outstable::detect_outliers( variable = "value", cmbn_model = c("lm", "theta","fasster"), p_rate = 0.01) %>% outstable::cleanse_data( variable = "value", impute = "linear") %>% fabletools::autoplot(.altered)
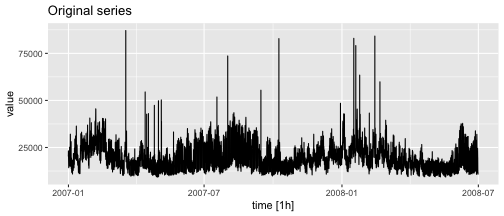
24
25
Load forecasting comparison


26
What next?
- Combinations forecast with robust methods for time series
27
What next?
- Combinations forecast with robust methods for time series
- Incorporating weights when combining the forecasts
27
What next?
- Combinations forecast with robust methods for time series
- Incorporating weights when combining the forecasts
- Extend the algorithm to work with Multivariate time series and High-Dimensional Tensor Time Series
27
What next?
- Combinations forecast with robust methods for time series
- Incorporating weights when combining the forecasts
- Extend the algorithm to work with Multivariate time series and High-Dimensional Tensor Time Series
- Controlling both false positive and false negative rate
27
What next?
- Combinations forecast with robust methods for time series
- Incorporating weights when combining the forecasts
- Extend the algorithm to work with Multivariate time series and High-Dimensional Tensor Time Series
- Controlling both false positive and false negative rate
- Do more experiments on density estimation methods to get a better tail estimation.
27
Thank You
devtools::install_github("pridiltal/outstable")

Slides available at: prital.netlify.app
priyangad@uom.lk
pridiltal
@pridiltal
Slides created via the R package xaringan
28
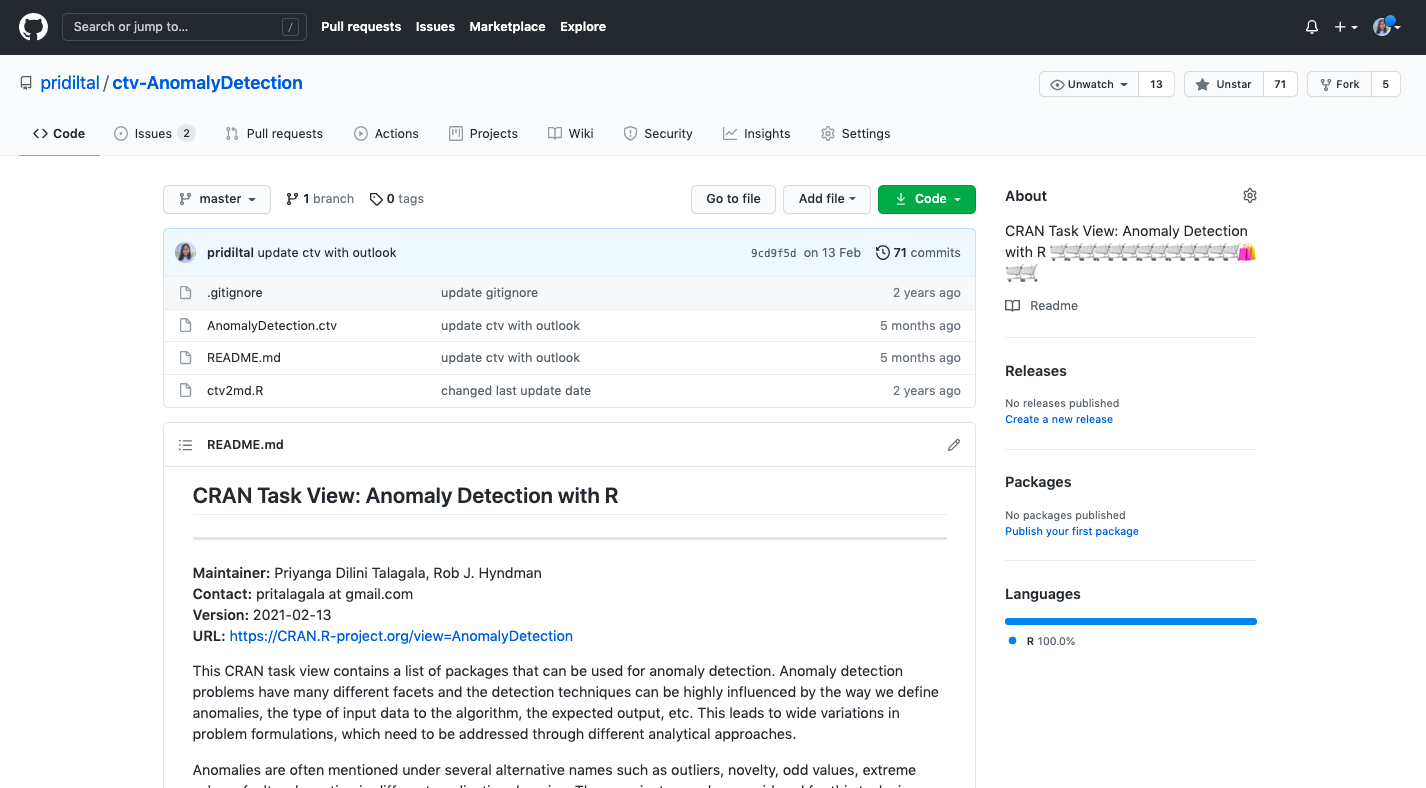
CRAN Task View: Anomaly Detection with R
29