class: center, middle, inverse, title-slide #
Anomaly Detection in Spatio-Temporal Tensor Streams
##
Priyanga Dilini Talagala
###
JSM 2021
###
08/08/2021
<i class="fab fa-twitter faa-horizontal animated " style=" color:#0fb7fa;"></i>
pridiltal
<i class="fas fa-globe faa-horizontal animated " style=" color:green;"></i>
prital.netlify.app
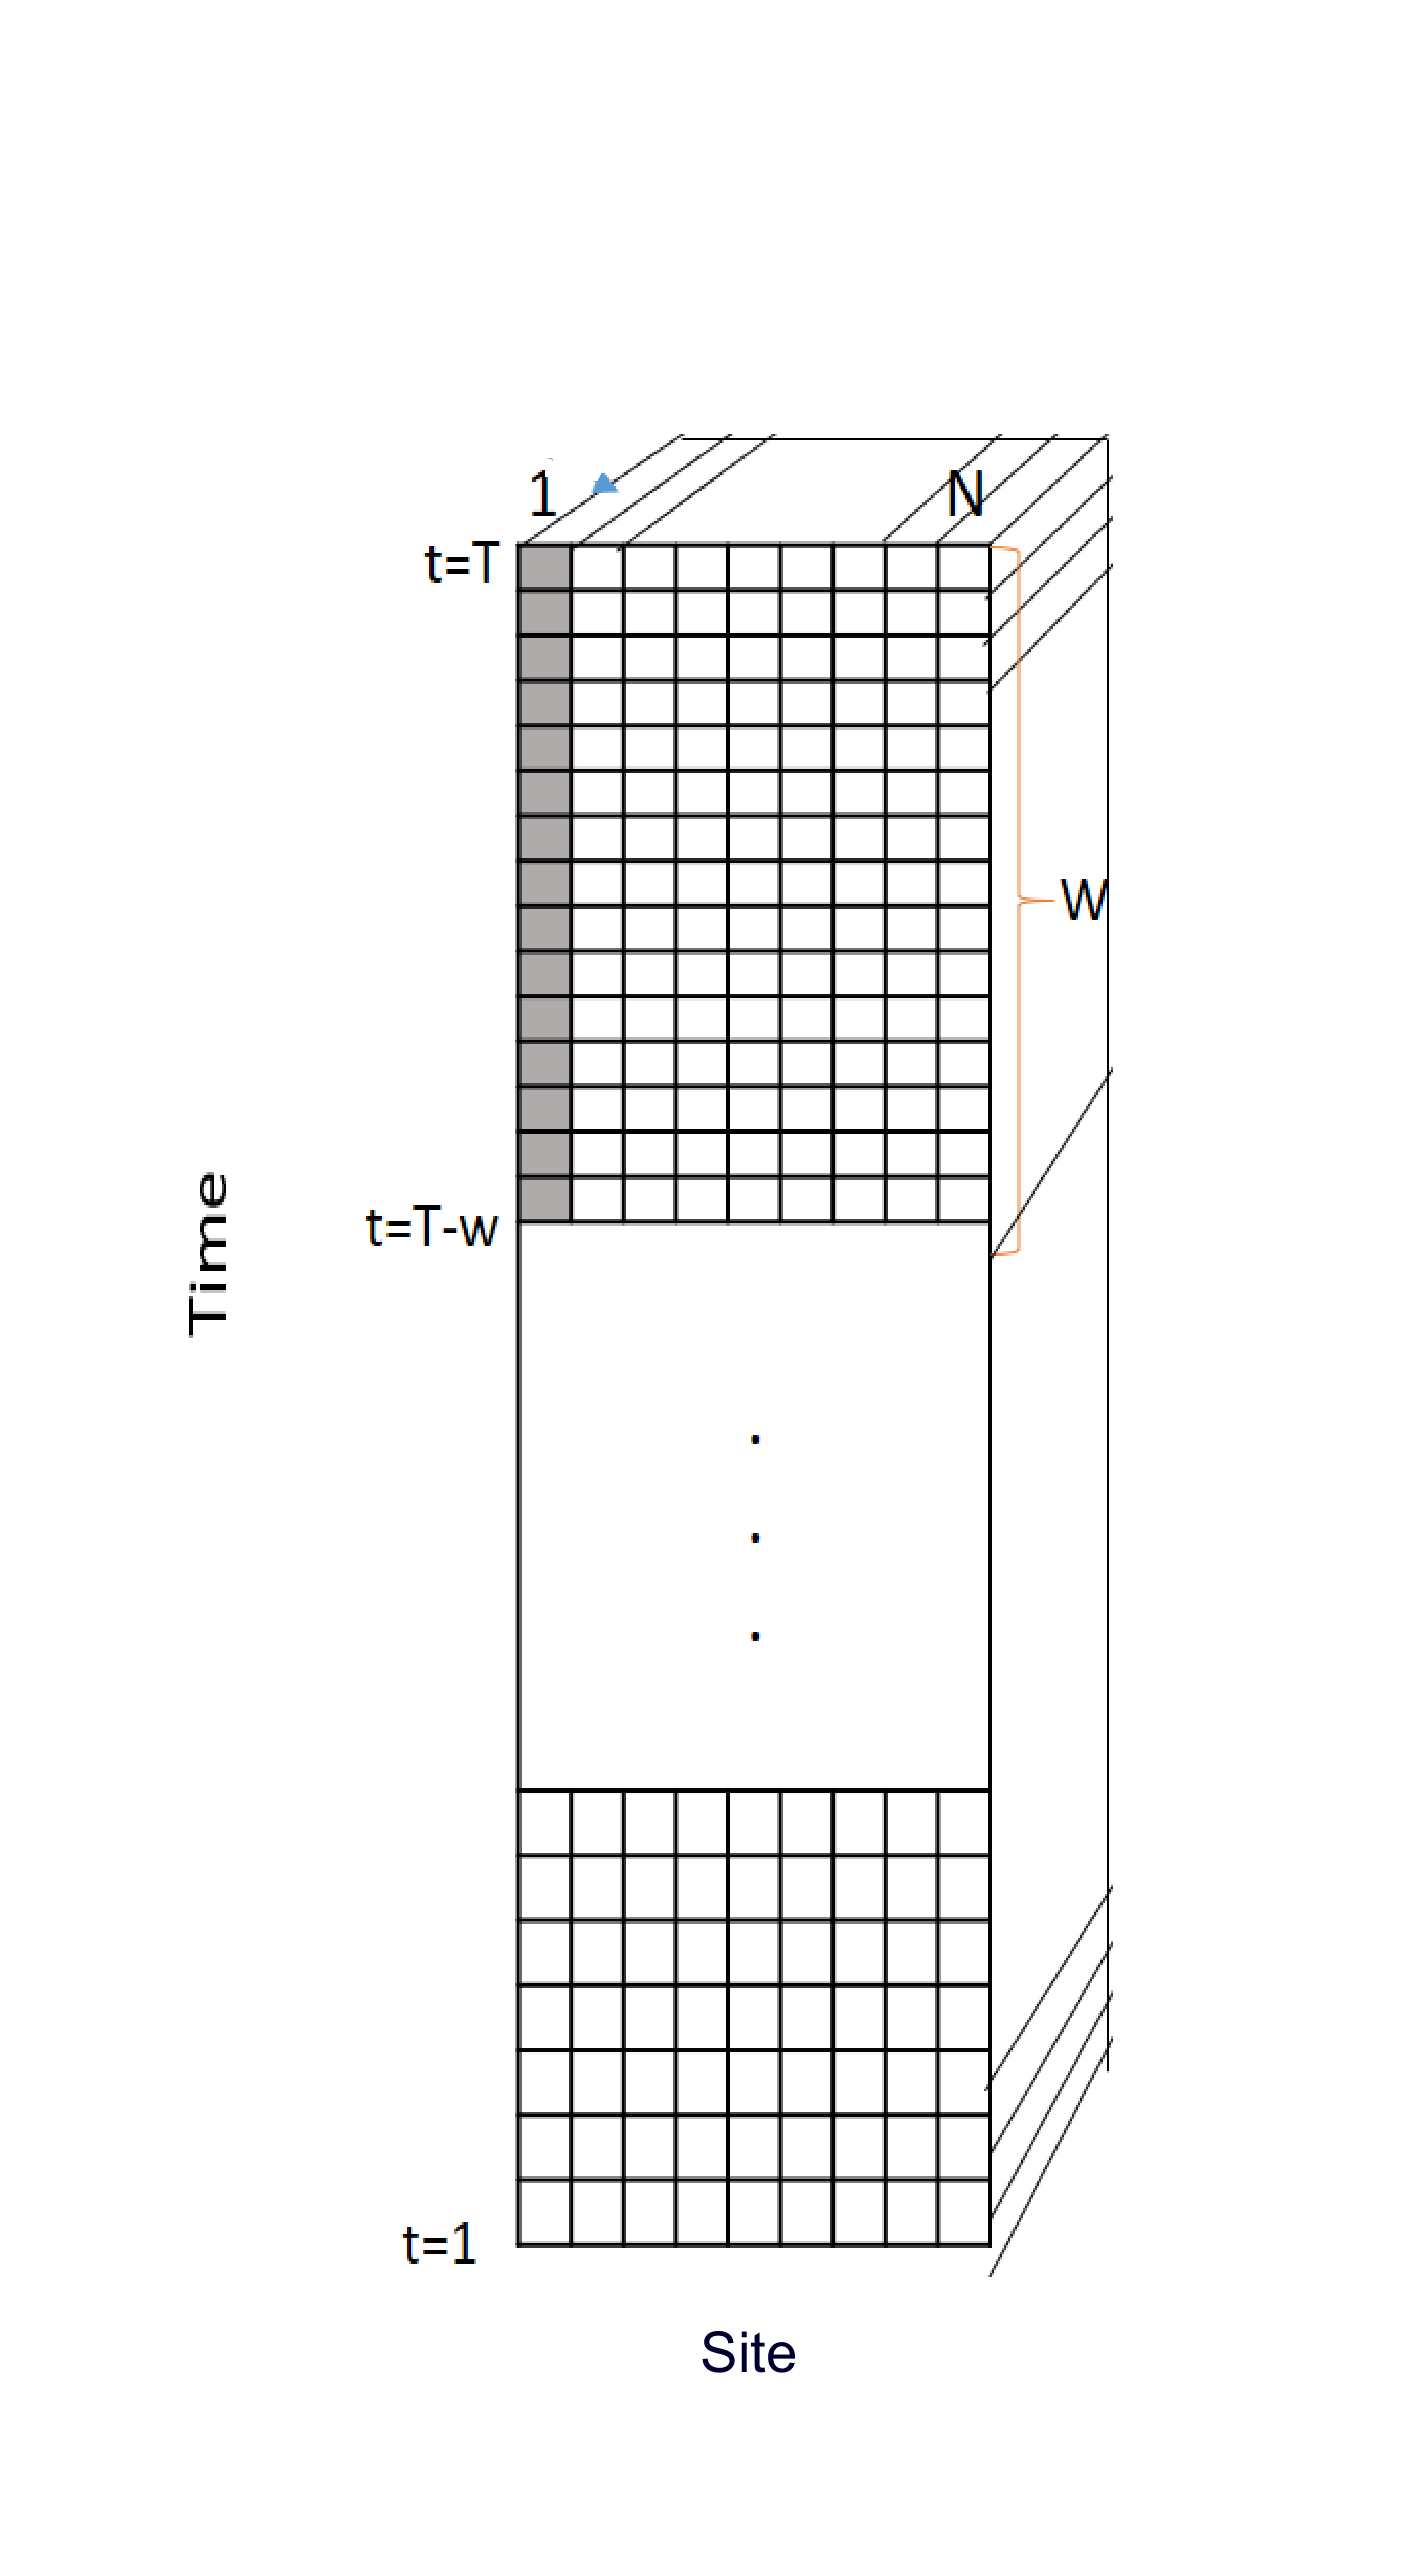
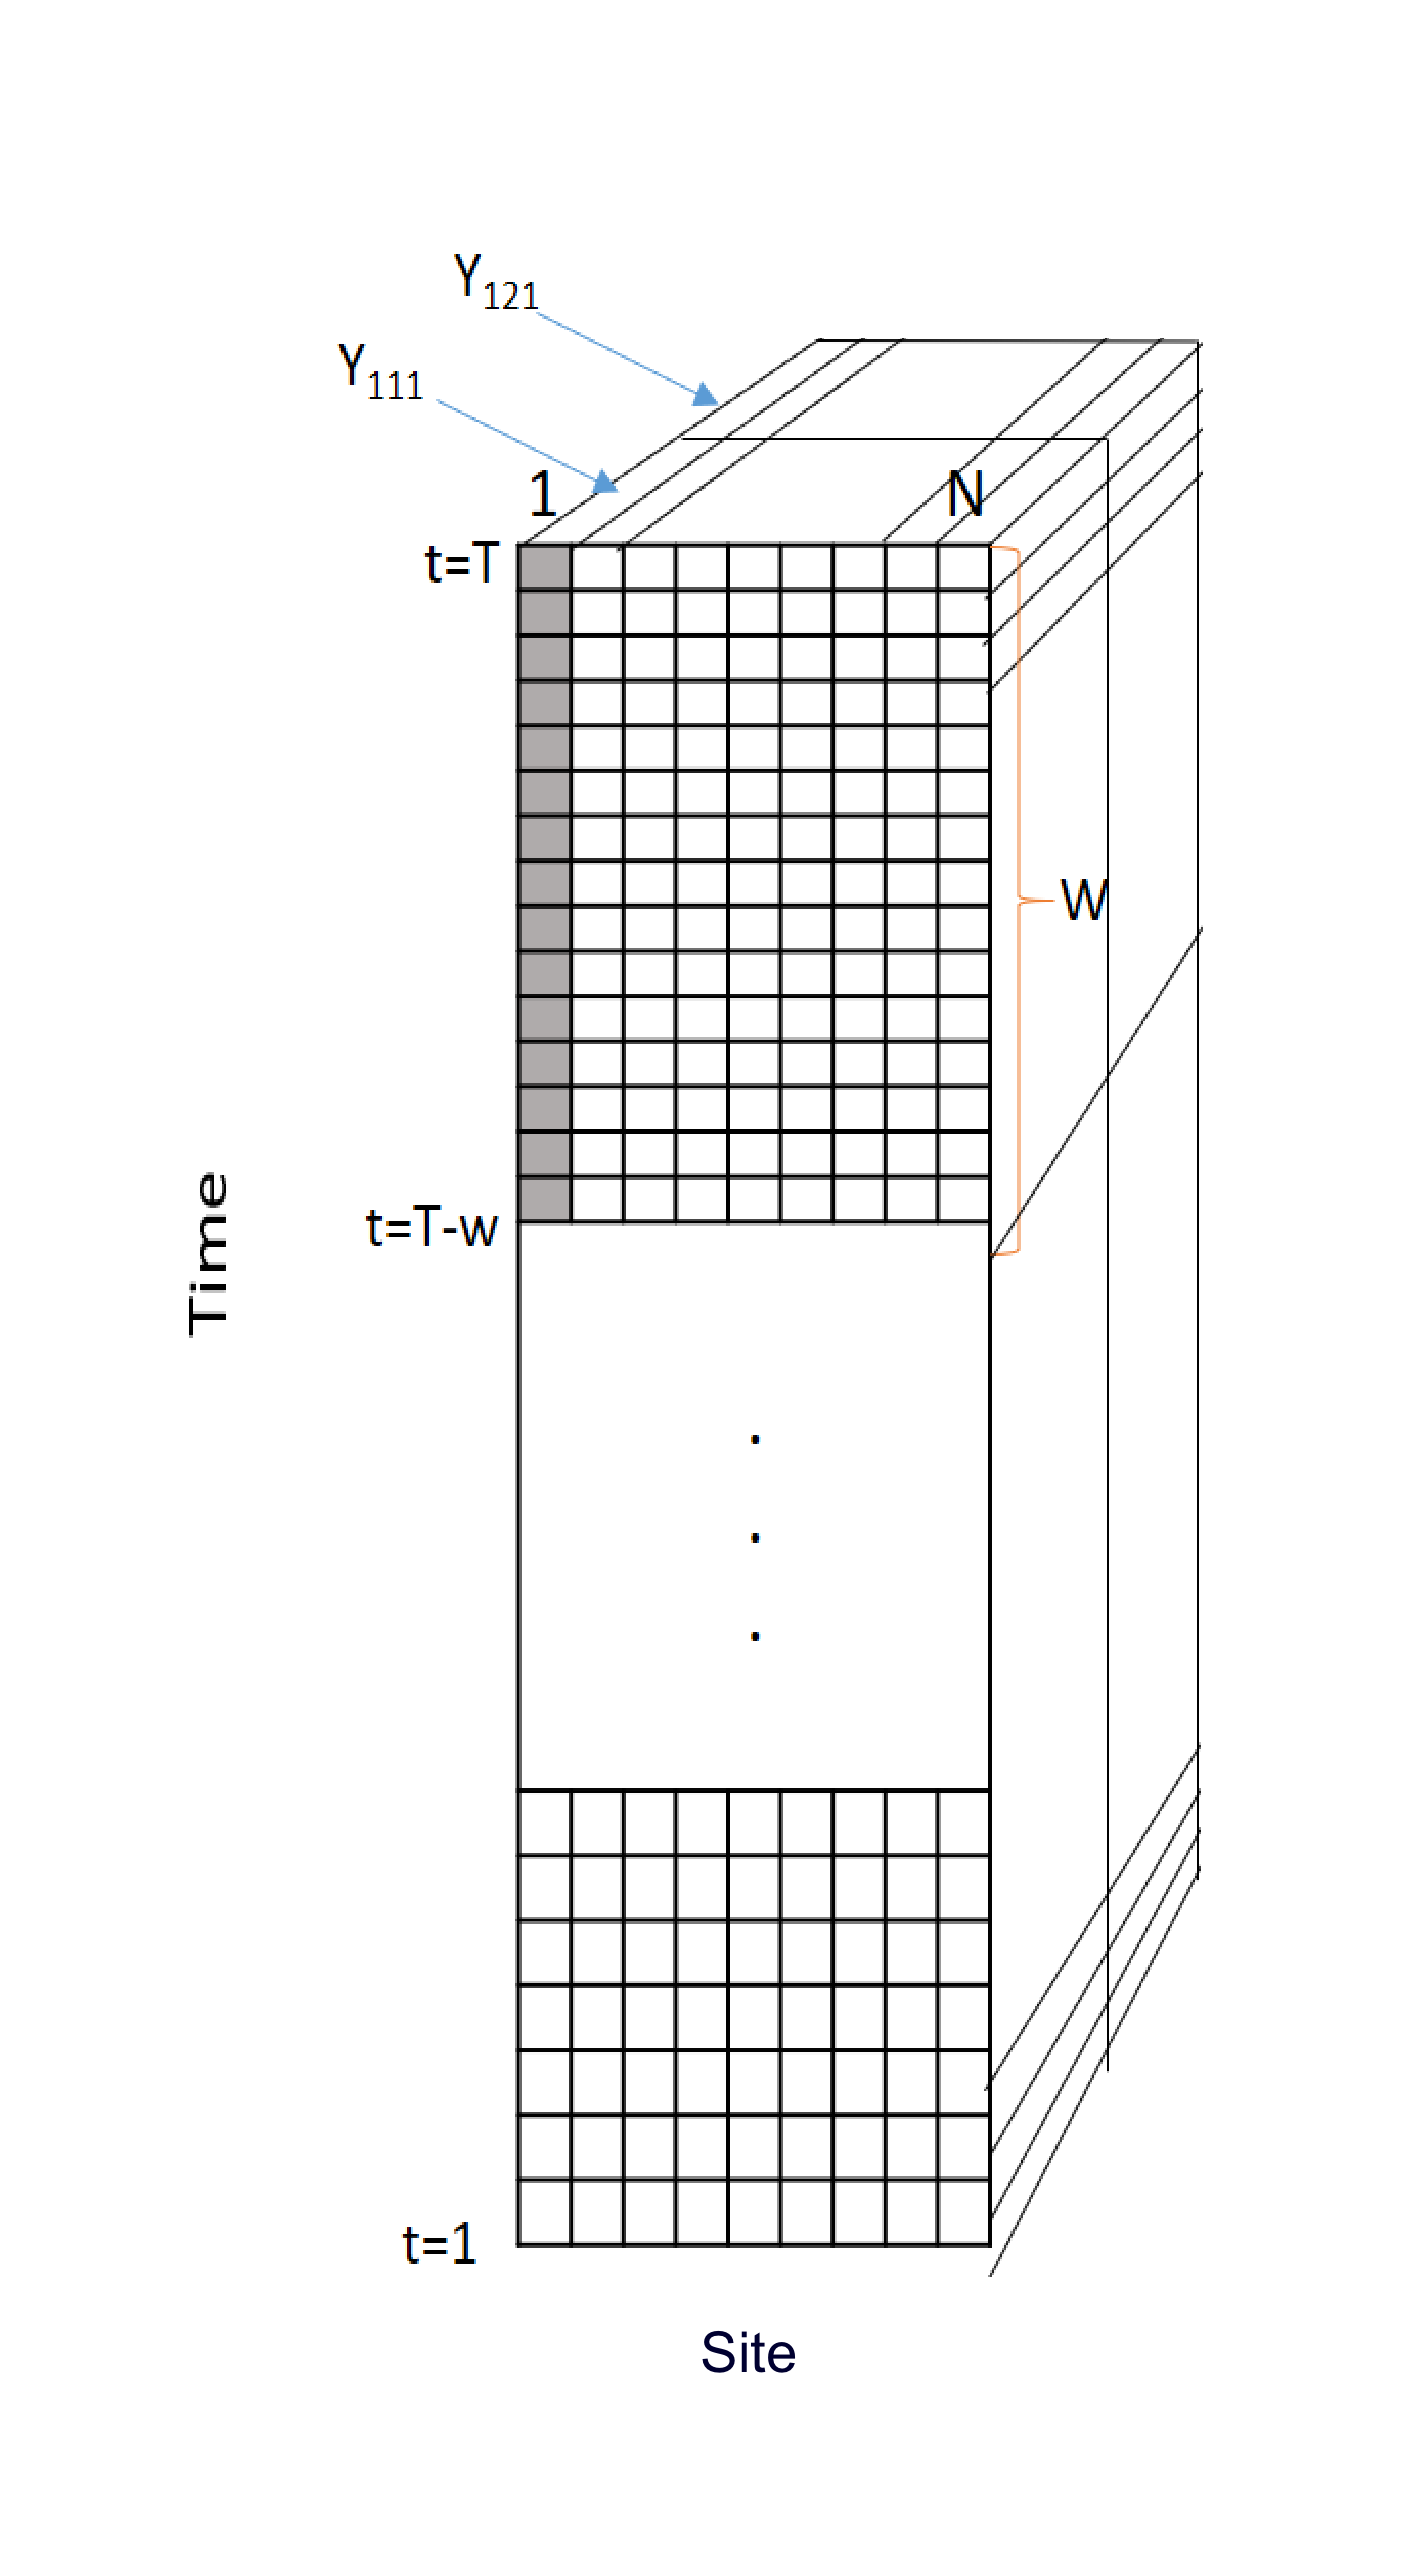
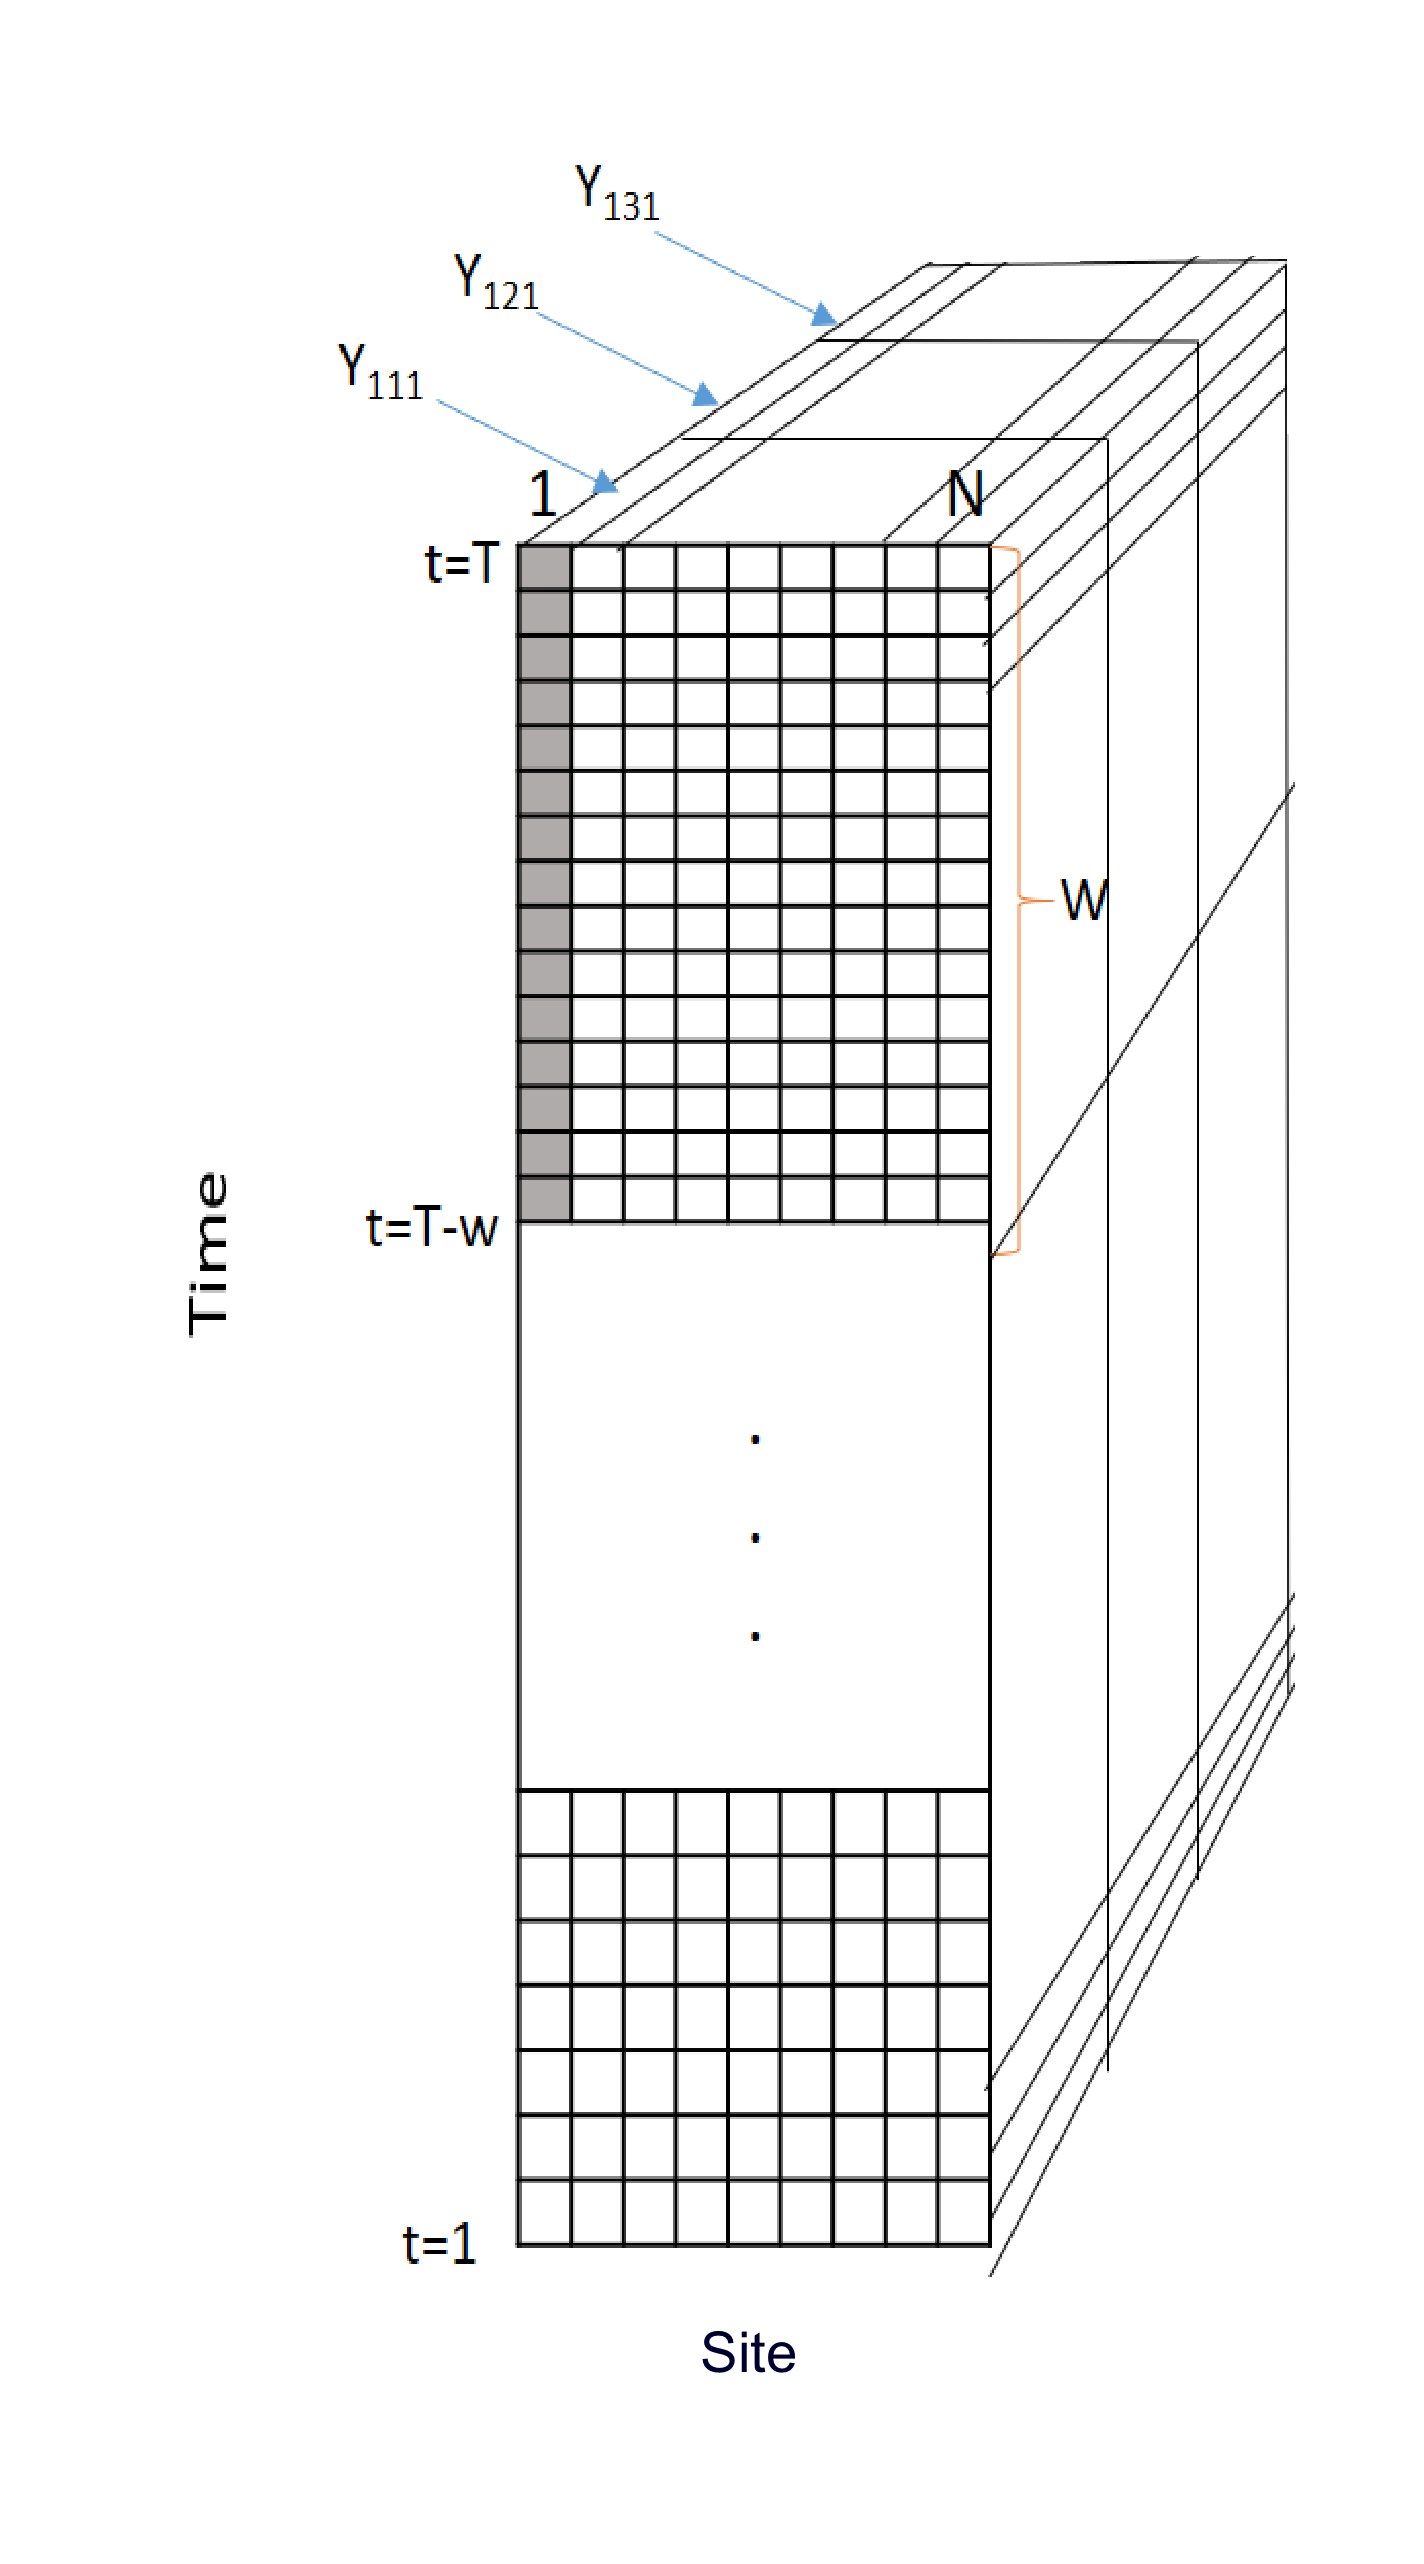
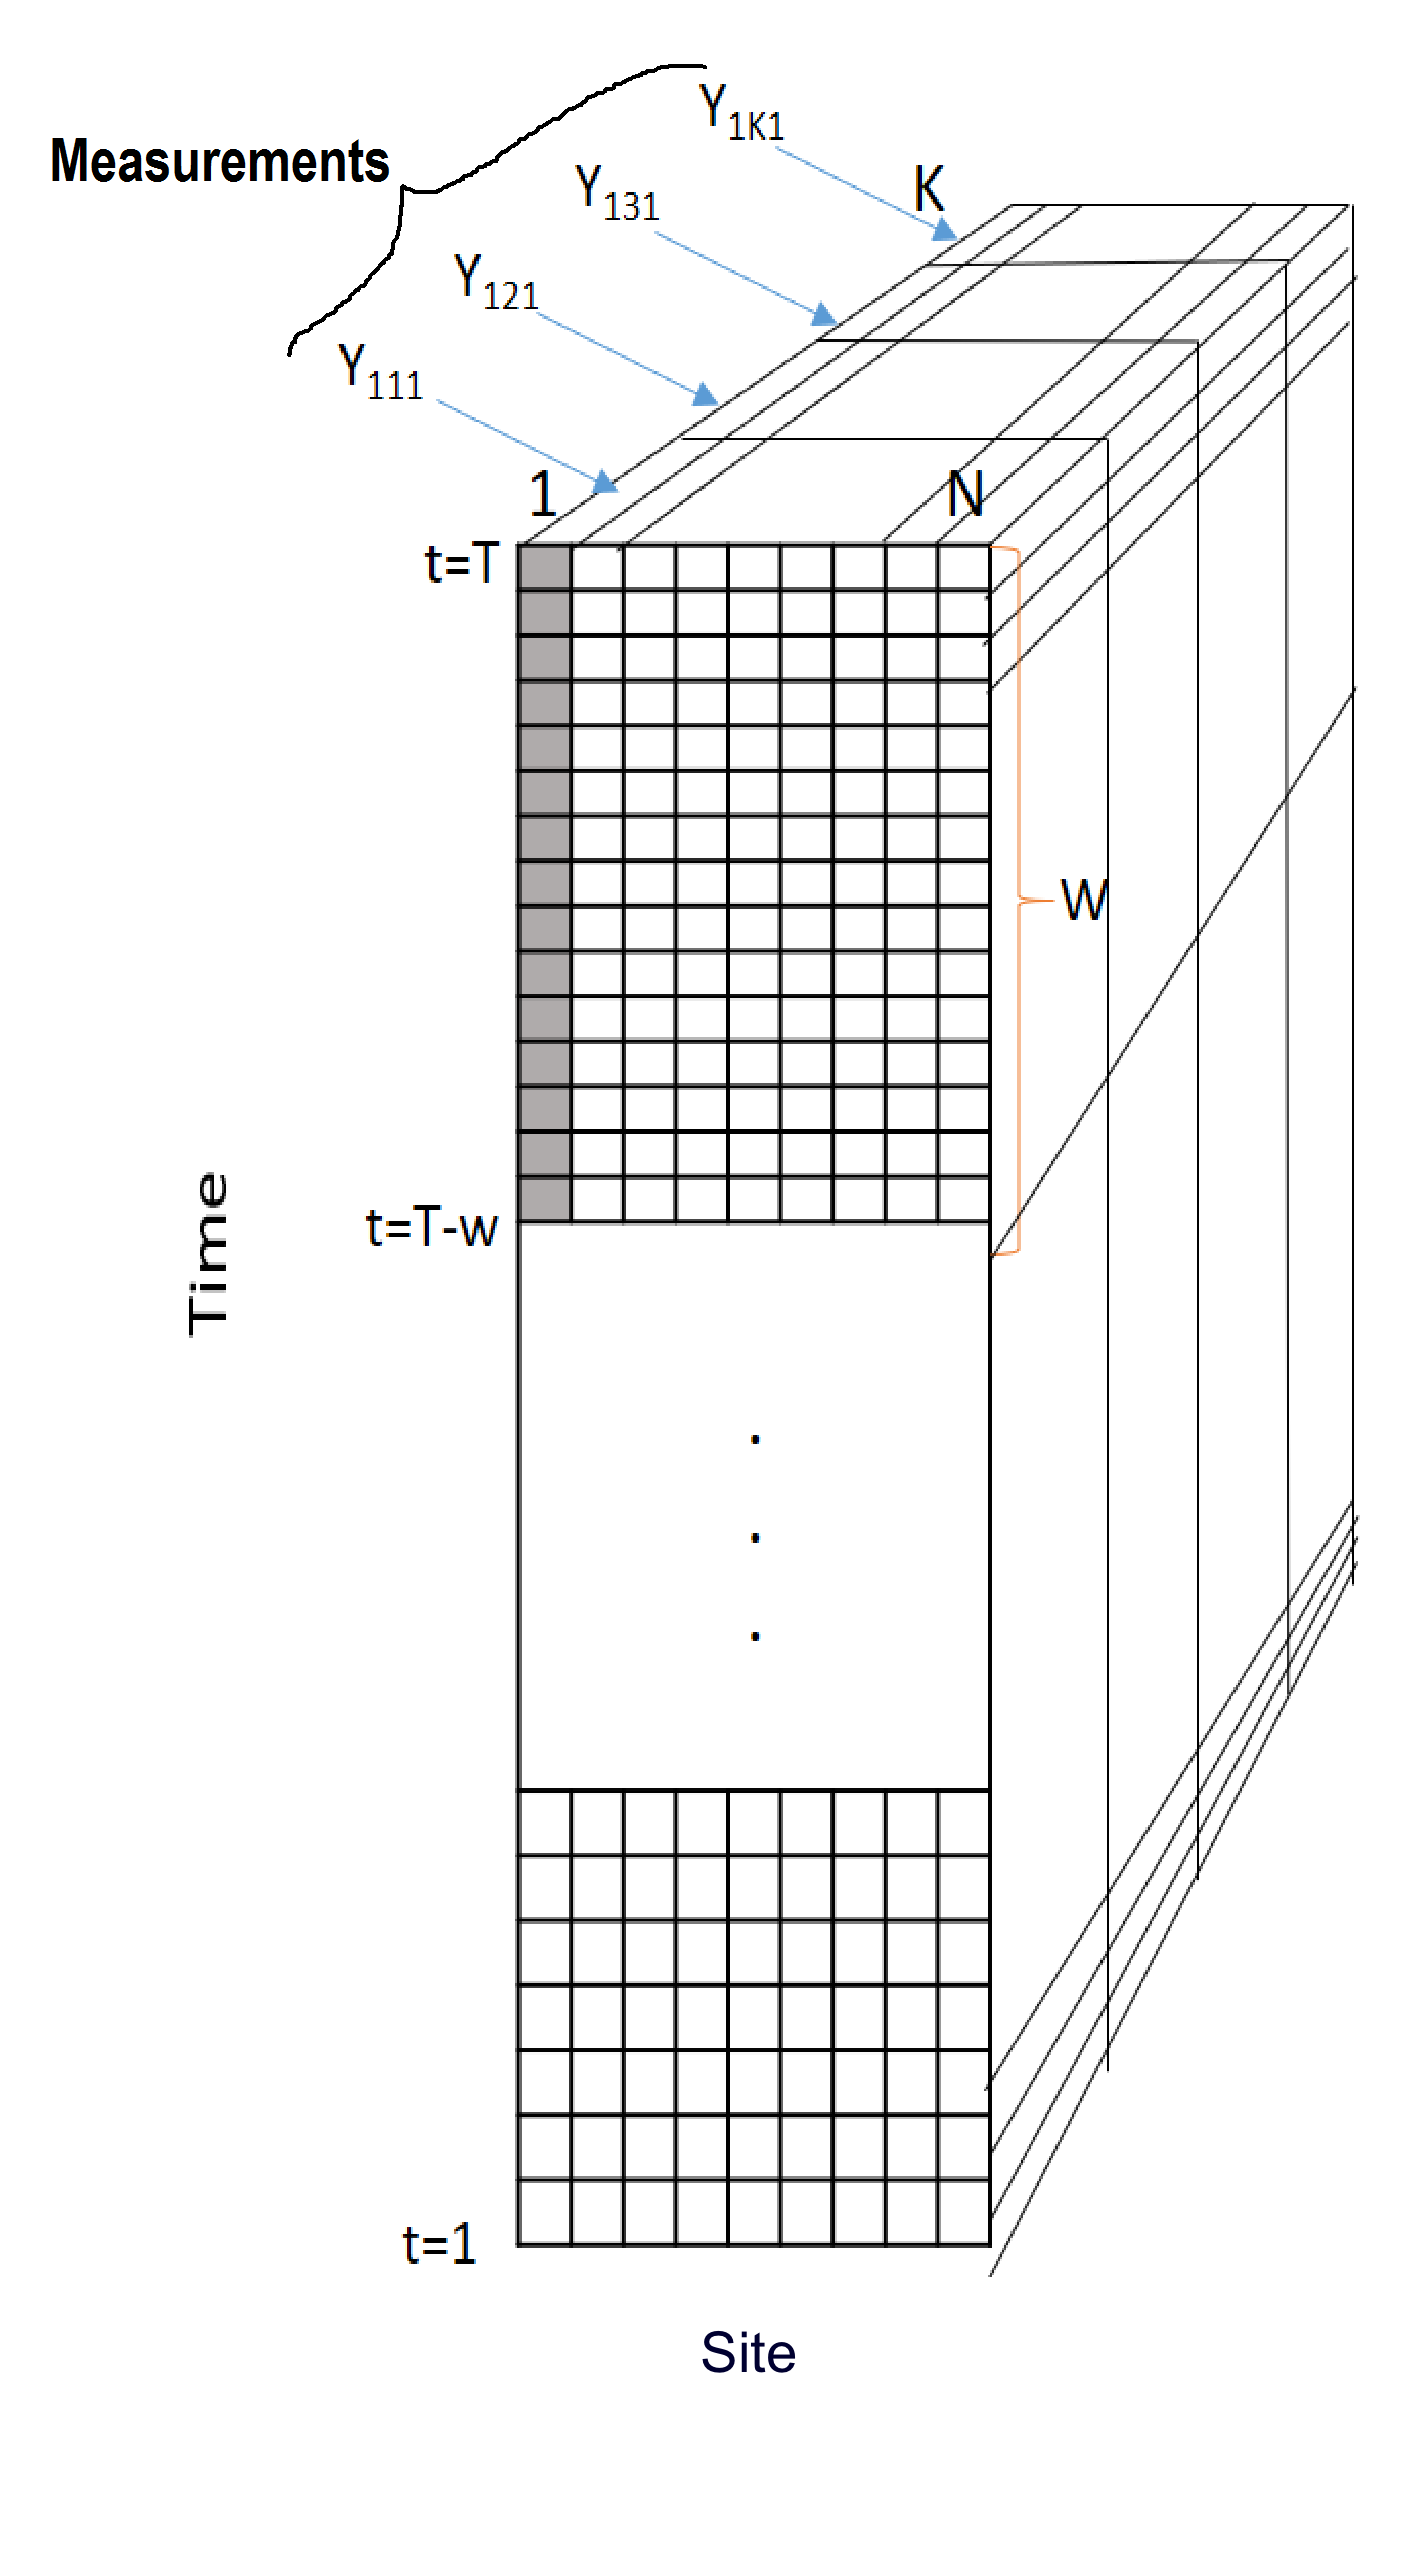
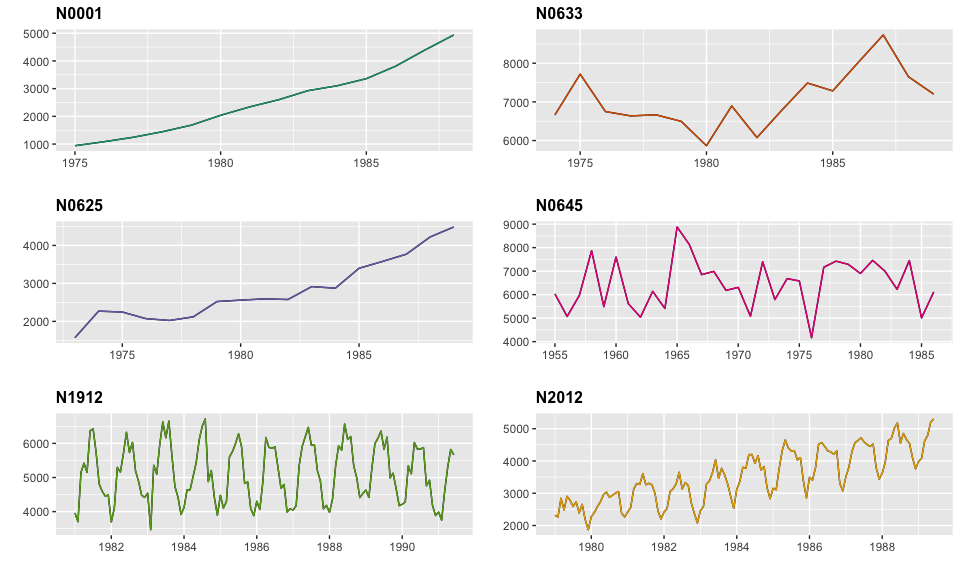
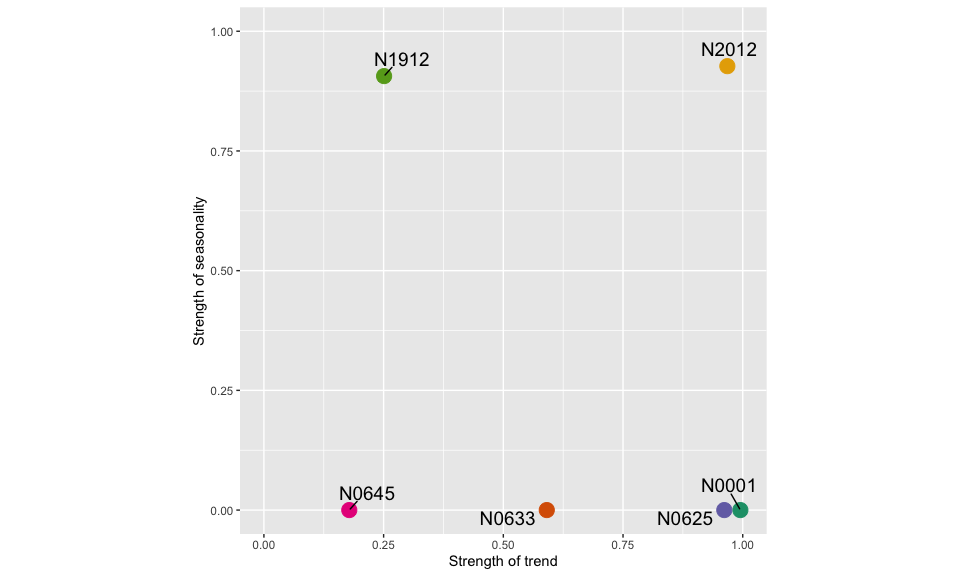
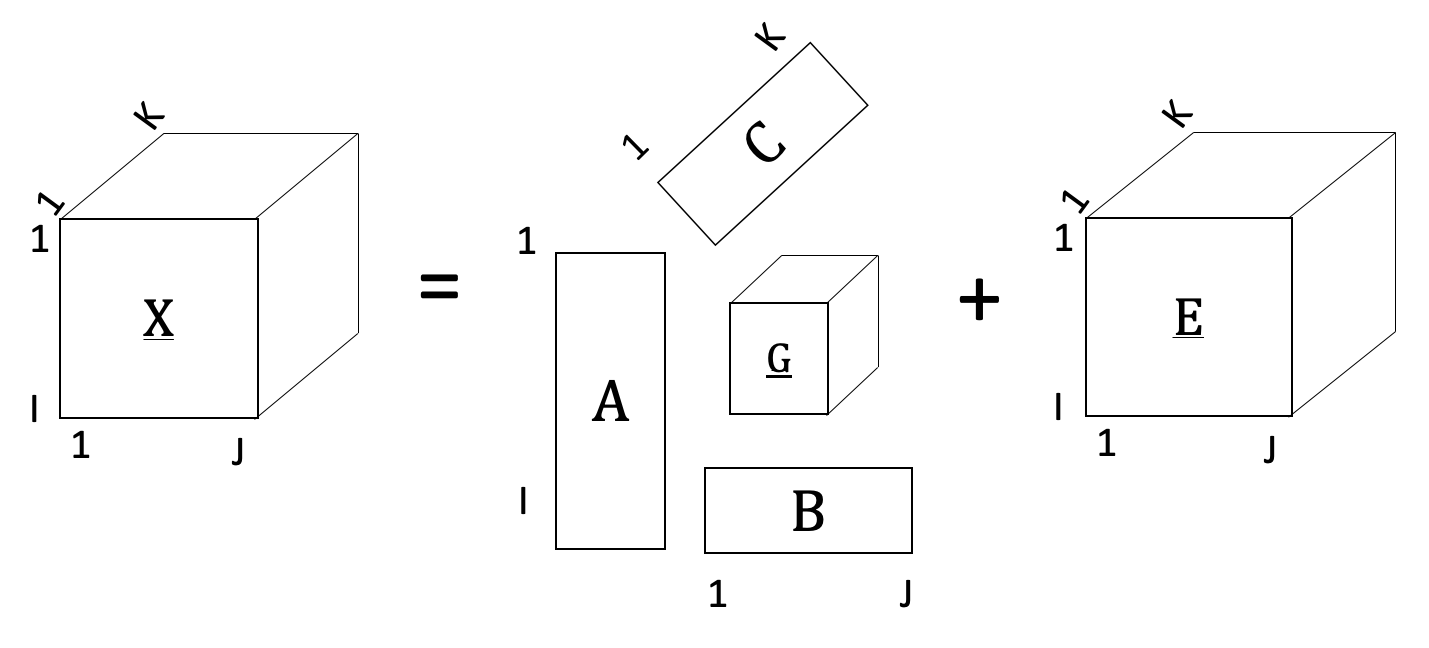
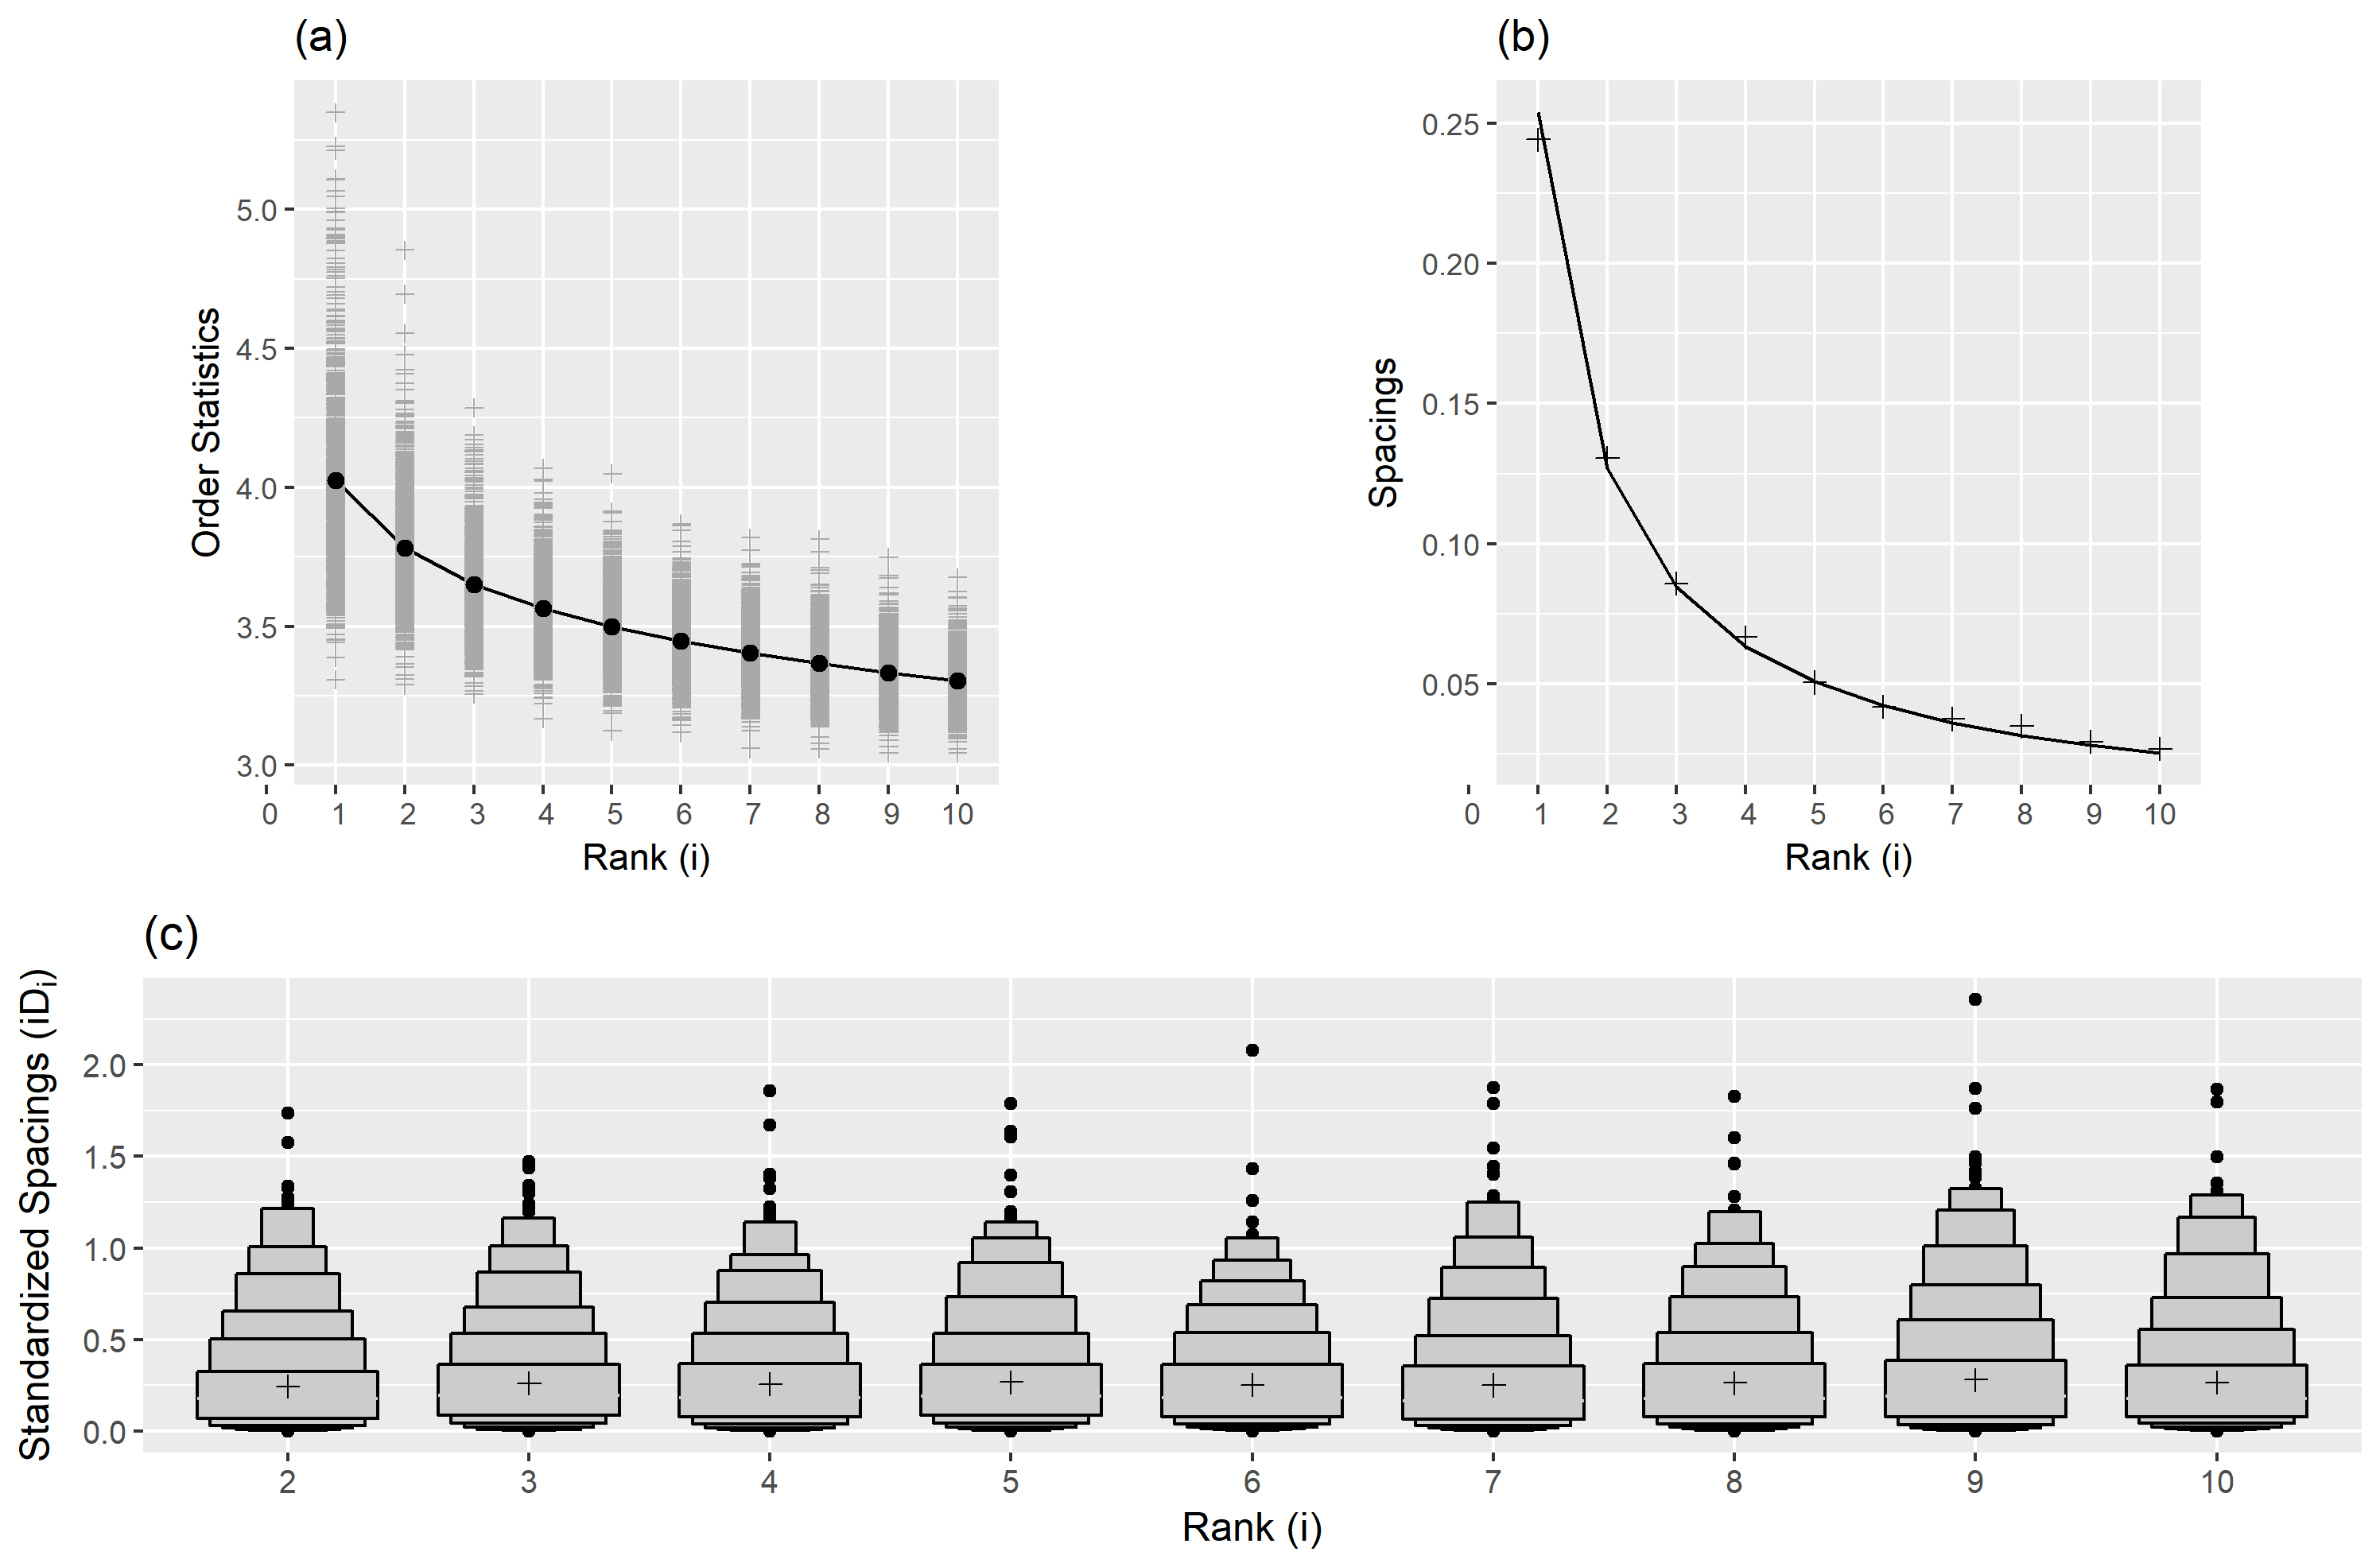
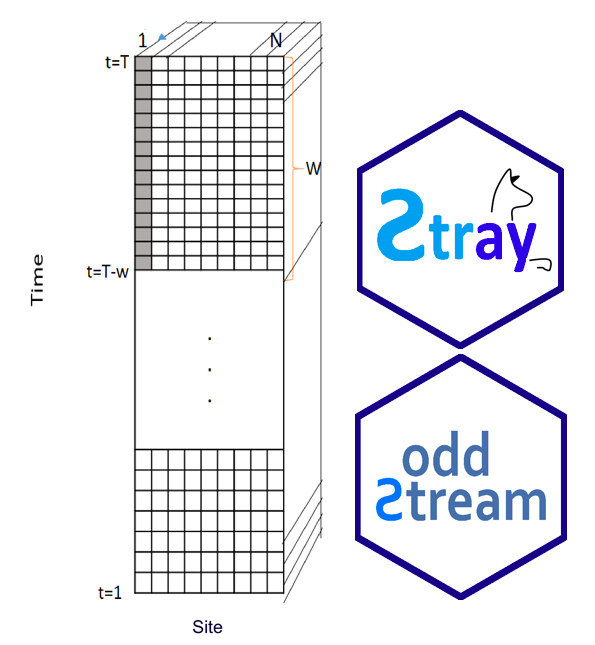
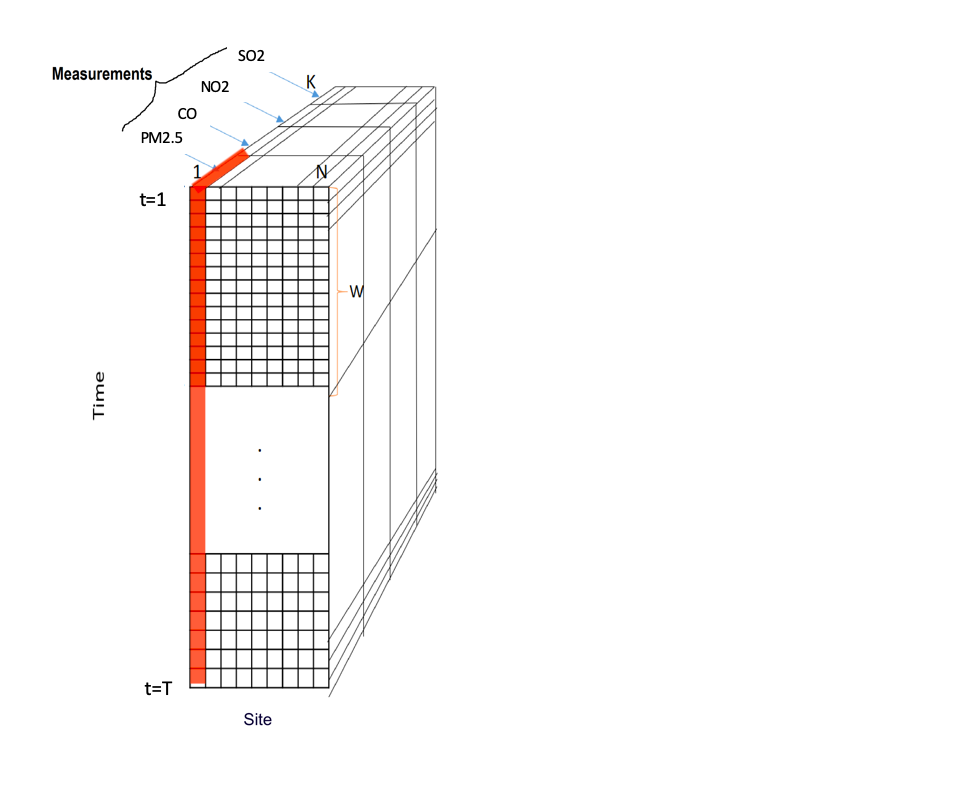
--- background-image:url('figure/3_water.png') background-position: 60% 85% background-size: 110% class: right, top <!-- - flood warning systems - river network - algi bloom - sensor outliers - Figure 3. A fish kill in August 2003 due to severe hypoxia in Greenwich Bay, near Narragansett Bay, RI. Photo by Chris Deacutis.[6] - water temperature monitoring Network - This poses a public health threat to surfers, swimmers, and aquatic life, and it can arise from sewer line breaks that occur during storms, leaky septic tanks, or illegal release of waste water into rivers. --> --- background-image:url('figure/4_energy.png') background-position: 60% 85% background-size: 110% class: right, top <!-- - solar - gas oil pipeline leakages - electricity - spot defects in solar panels in solar farms - Strong winds can damage the panel's system. Consequently, there is an option to add a wind sensor to this system. The sensor provides information about wind speed and is input into Pin8. https://www.fierceelectronics.com/components/solar-tracker-improves-energy-output-solar-panels - Real-time Alert system and pipeline Leakage detection Biz4Intellia, an end-to-end IoT solution saves bucks to the companies by providing instant notification of pipeline leakage. By quickly addressing the problem, our solution prevents oil/gas seeping further into the environment where it could have a significant impact on wildlife, plants, and water. The Real-time Alert system detects the leakage and addresses them immediately, which saves money, oil, and the environment. All the information from the sensors is acquired and sent to the cluster cloud. With all the real-time data and geek technology one can predict the 96% accurate data and can send alerts well before time. The moment a leak alert is received, one can take immediate action to ensure that damage is mitigated. https://www.mdpi.com/1424-8220/19/11/2548/htm The operation principle of this method is that cable temperature will change when pipeline leakage occurs and hydrocarbon fluid engross into the coating cable. By measuring the temperature variations in fibre optic cable anomalies along the pipeline can be detected [4]. Distributed Optical Fibre Sensor (DOFS) provides environmental measurements based on three classes of scattering, namely Raman, Rayleigh and Brillouin scattering [64]. These classifications are based on the frequency of the optical signals as illustrated in Figure 3. Brillouin scattering can measure both strain and temperature but is very sensitive to strain, while Raman scattering is only sensitive to temperature, with greater ability to accurately measure - Energy Outlier Detection in Smart Environments - Earlier studies have shown that home residents reduce en- ergy expenditure by 5-15% on average just as a response to acquiring and viewing raw usage data (Darby 2006). Tra- ditional power meters provide only basic consumption data such as current power usage and killowatt hour. There is a clear need for improving householders??? working knowledge of their behaviors and energy consumption. Pervasive com- puting techniques can improve the quality of information supplied to users by identifying usage trends and anoma- lies, and providing users with suggestions about how to save energy and conserve natural resources. Anomaly detection is valuable because the anomaly may indicate an unnecessary use of resources (e.g., an appliance was accidentally left on), an unsafe state, or possibly noise in the dataset which needs to be removed. --> --- <!-- background-image:url('figure/5_environment.png') background-position: 60% 85% background-size: 110% class: right, top <!-- - earthquake - air pollution bushfire --> ## Motivation - All these applications generate millions or even billions of individual time series simultaneously -- - Research question: Finding locations of unusual behaviours --- ### Spatio-Temporal Data <img src="figure/13_MDdata.png" width="30%" style="display: block; margin: auto;" /> --- background-image:url('figure/17_oddstream.png') background-position: 70% 50% background-size: 100% class: left, top ### Spatio-Temporal Data --- ### Spatio-Temporal Data <img src="figure/13_MDdata.png" width="30%" style="display: block; margin: auto;" /> --- ### Spatio-Temporal
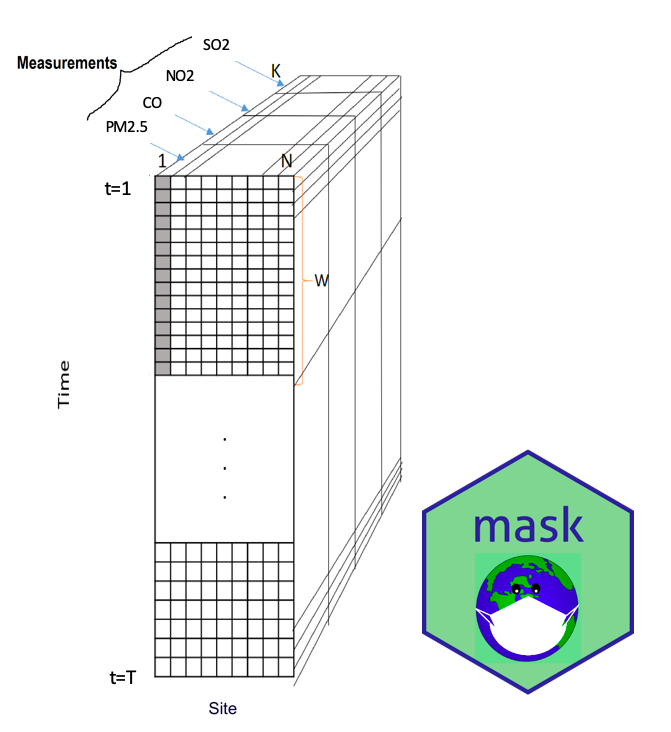
Tensor
Data <img src="figure/14_MDdata.png" width="30%" style="display: block; margin: auto;" /> --- ### Spatio-Temporal <span style="color:orange">Tensor</span> Data <img src="figure/15_MDdata.png" width="30%" style="display: block; margin: auto;" /> --- ### Spatio-Temporal <span style="color:orange">Tensor</span> Data <img src="figure/16_MDdata.png" width="30%" style="display: block; margin: auto;" /> --- ### Spatio-Temporal
Tensor
Data <img src="figure/16_MDdata.png" width="30%" style="display: block; margin: auto;" /> --- class: bottom, center, inverse ##
A
nomaly Detection in <br/>
M
ultivariate
S
patio-temporal data <br/> with
K
-measurements <div class="figure" style="text-align: center"> <img src="figure/19_hexstickermask.png" alt="devtools::install_github("pridiltal/mask")" width="20%" /> <p class="caption">devtools::install_github("pridiltal/mask")</p> </div> --- background-image:url('figure/20_india.png') background-position: 60% 80% background-size: cover class: left, top ### India hourly air pollution data from 244 stations from October 2019 to September 2020 <!-- .pull-left[ - PM2.5 - PM10 - NO2 - NH3 ] .pull-right[ - SO2 - CO - OZONE ] --> # <span style="color:yellow">7 of the world's 10 most polluted cities are in India </span> *(Source: IQAir AirVisual 2018 World Air Quality Report & Greenpeace)* - PM2.5, PM10, NO2, NH3, SO2, CO, OZONE <!-- I have been collecting these hourly pollution data for about a year to understand how different Pollutants changes and get affected over the year across different states in India. I have also attached a .hyper (Tableau Data Extract) which can be used for the analysis of this data on Tableau. https://www.kaggle.com/prateekcoder/ind-hourly-air-pollution-data-oct2019-to-sept2020?select=Air_Pollution_Data_Oct_2019_Sept_2020.hyper 7 out of 10 are from india https://www.weforum.org/agenda/2019/03/7-of-the-world-s-10-most-polluted-cities-are-in-india/--> --- ### MASK Framework #### Main Contributions - Propose a framework to detect spatial anomalies in spatio-temporal tensor data - Unsupervised anomaly detection algorithm -- #### What is an anomaly ? - An anomaly is a spatial point or region that deviates significantly from the global and/or local distribution of a given network <!-- A representative data set of the system's typical behavior is available to define the model for the typical behavior of the system. --> --- .pull-left[ #### Time-domain representation <img src="figure/32_ts.png" width="120%" style="display: block; margin: auto;" /> ].pull-right[ #### Feature-domain representation <img src="figure/33_feature.png" width="120%" style="display: block; margin: auto;" /> ] .footnote[ **Figure reproduced from** Talagala, T. S., Hyndman, R. J., & Athanasopoulos, G. (2018). Meta-learning how to forecast time series. Monash Econometrics and Business Statistics Working Papers, 6, 18. ] --- ### Feature based representation of time series .pull-left[ - Mean - Variance - Changing variance in remainder - Level shift using rolling window - Variance change - Strength of linearity - Strength of curvature - Strength of spikiness ] .pull-right[ - Burstiness of time series (Fano Factor) - Minimum - Maximum - The ratio between 50% trimmed mean and the arithmetic mean - Moment - Ratio of means of data that is below and above the global mean ] --- ### Feature based representation of time series <img src="figure/21_maskfe.png" width="60%" style="display: block; margin: auto;" /> --- ### Feature based representation of time series <img src="figure/22_maskfe.png" width="60%" style="display: block; margin: auto;" /> --- background-image:url('figure/24_U_PCA.png') background-position: 60% 80% background-size: 90% class: left, top ### Naive approach (Unfold PCA) #### Batch-wise unfolding of the three-way matrix into a two-dimensional matrix. <!-- <img src="figure/24_U_PCA.png" width="120%" style="display: block; margin: auto;" /> - Consider them as separate column - increases curse of dimensionality - do not consider the correlation structure --> <!-- This paper explains the multi-way decomposition method PARAFAC and its use in chemometrics. PARAFAC is a generalization of PCA to higher order arrays, but some of the characteristics of the method are quite different from the ordinary two-way case. There is no rotation problem in PARAFAC, and e.g., pure spectra can be recovered from multi-way spectral data. One cannot as in PCA estimate components successively as this will give a model with poorer fit, than if the simultaneous solution is estimated. Finally scaling and centering is not as straightforward in the multi-way case as in the two-way case. An important advantage of using multi-way methods instead of unfolding methods is that the estimated models are very simple in a mathematical sense, and therefore more robust and easier to interpret. All these aspects plus more are explained in this tutorial and an implementation in Matlab code is available, that contains most of the features explained in the text. Three examples show how PARAFAC can be used for specific problems. The applications include subjects as: Analysis of variance by PARAFAC, a five-way application of PARAFAC, PARAFAC with half the elements missing, PARAFAC constrained to positive solutions and PARAFAC for regression as in principal component regression. https://www.sciencedirect.com/science/article/abs/pii/S0169743997000324--> --- background-image:url('figure/25_tucker3.png') background-position: 50% 110% background-size: 90% class:left, top ### Anomalous score calculation using Robust three-way analysis <!-- ****Parafac Can be seen as an expansion of PCa from two way data to multiway data In particular, given the true multi-way nature of the data, PARAFAC model turned out to be extremely useful in the study of the dependence of colour variation on pigments, a critical issue for painted surfaces, that was not clear using univariate approach. N-PLS: N-way Partial Least Squares regression PARAFAC: Parallel Factor Analysis; a.k.a. CPD: canonical polyadic decomposition PCA: Principal Component Analysis PLS: Partial Least Squares regression https://www.youtube.com/watch?v=_gIb6PzBEc4 https://www.youtube.com/watch?v=vyjUotbPfHY https://www.youtube.com/watch?v=L8uT6hgMt00 -iiiiiiiiiiiii - India datasets - lockdown March 24 - India covid situation --> --- background-image:url('figure/26_tucker3.png') background-position: 50% 110% background-size: 90% class: left, top ### Anomalous score calculation using Robust three-way analysis --- #### Anomalous score calculation using Robust three-way analysis .pull-left[ - Matrix SVD (Singular-Value Decomposition) <img src="figure/34_SVD.png" width="100%" style="display: block; margin: auto;" /> ] -- .pull-right[ - The Tucker3 Model <img src="figure/35_tucker3.png" width="100%" style="display: block; margin: auto;" /> ] --- .pull-left[ ### The Robust Tucker3 Model `$$\mathbf{X}_A=\mathbf{AG}(\mathbf{C} \otimes \mathbf{B})^t + \mathbf{E}$$` - Fitted model `$$\mathbf{\hat{X}}_A=\mathbf{\hat{A}\hat{G}}(\mathbf{\hat{C}} \otimes \mathbf{\hat{B}})^t$$` - Objective function: `$$\sum_{i=1}^I\sum_{j=1}^J\sum_{k=1}^K (x_{ijk}- \hat{x}_{ijk})^2$$` `$$=\sum_{i=1}^I(\mathbf{x_i-\mathbf{\hat{x_i}}})(\mathbf{x_i-\mathbf{\hat{x_i}}})^t$$` ] .pull-right[ <img src="figure/35_tucker3.png" width="100%" style="display: block; margin: auto;" /> - Residual distance: `$$RD_i=\sqrt{\sum_{j=1}^J\sum_{k=1}^K (x_{ijk}- \hat{x}_{ijk})^2}$$` .footnote[ Palma, Todorov and Gallo (2014) ] ] --- background-image:url('figure/26_tucker3.png') background-position: 50% 110% background-size: 90% class: left, top ### Anomalous score calculation using Robust three-way analysis --- ### Anomalous threshold calculation using Spacing theorem (Weissman, 1978) .pull-left[ <span style="font-size:14.0pt"> Let `\(X_{1}, X_{2}, ..., X_{n}\)` be a sample from a distribution function `\(F\)`. </span> </br> </br> <span style="font-size:14.0pt">Let `\(X_{1:n} \geq X_{2:n} \geq ... \geq X_{n:n}\)` be the order statistics. </span> </br> </br> <span style="font-size:14.0pt">The available data are `\(X_{1:n}, X_{2:n}, ..., X_{k:n}\)` for some fixed `\(k\)`. </span> </br> </br> <span style="font-size:14.0pt"> Let `\(D_{i,n} = X_{i:n} - X_{i+1:n},\)` `\((i = 1,2,..., k)\)` be the spacing between successive order statistics. </span> </br> </br> <span style="font-size:14.0pt"> If `\(F\)` is in the maximum domain of attraction of the Gumbel distribution, then the spacings `\(D_{i,n}\)` are asymptotically independent and exponentially distributed with mean proportional to `\(i^{-1}\)`. </span> ].pull-right[ <img src="figure/29_evt.png" width="100%" style="display: block; margin: auto;" /> ] --- background-image:url('figure/27_india.png') background-position: 50% 80% background-size: 90% class: left, top #### India hourly air pollution data from 244 stations from October 2019 to September 2020 --- background-image:url('figure/28_india.png') background-position: 50% 80% background-size: 90% class: left, top #### India hourly air pollution data from 244 stations from October 2019 to September 2020 --- ### Advantages of the mask framework - Detect spatial anomalies in spatio-temporal tensor data -- - Can take the correlation structure of the variables into account when detecting anomalies -- - Deal with large amounts of data efficiently -- - Deal with time series of different lengths and/or starting points -- - Anomalous scoring techniques- unsupervised -- - Anomalous threshold has a probabilistic interpretation -- - The framework can easily be extended to streaming data such that it can provide near-real-time support <!-- - Thus, this representation can allow an algorithm to compare time series of different lengths and/or starting points, because it can transform time series of any length or starting point into a vector of features of a fixed size. Thus, this representation can allow an algorithm to compare time series of different lengths and/or starting points, because it can transform time series of any length or starting point into a vector of features of a fixed size. Recently, researchers such as Wang, Smith, and Hyndman (2006), Fulcher (2012) and Hyndman, Wang, and Laptev (2015) have paid a considerable amount of attention to the feature-based representation of time series, since it helps to reduce the dimension of the original multivariate time series problem via features that encapsulate the dynamic properties of the individual time series efficiently. Does not require a training set to build the decision model --> --- ### stray/oddstream Vs mask .pull-left[ <br/> <img src="figure/30_oddstream.png" width="90%" style="display: block; margin: auto;" /> - Definition: Recent past distribution of a given system - Semi-supervised ] .pull-right[ <img src="figure/31_mask.png" width="100%" style="display: block; margin: auto;" /> - Definition: Current global and/or local distribution of a given system - Unsupervised ] --- ### What next? - Explore more on feature extraction and feature selection methods to create a better feature space suitable for streaming data context. -- - Use other dimension reduction techniques for tensor data such as multilinear PLS (N-PLS) to see the effect on the performance of the proposed framework. -- - Develop effective, interactive data visualisation tools for further investigation of the detected spatial anomalies. <!--Natural extensions of two-way models--> --- class: center, bottom, inverse ## Thank you .pull-left[
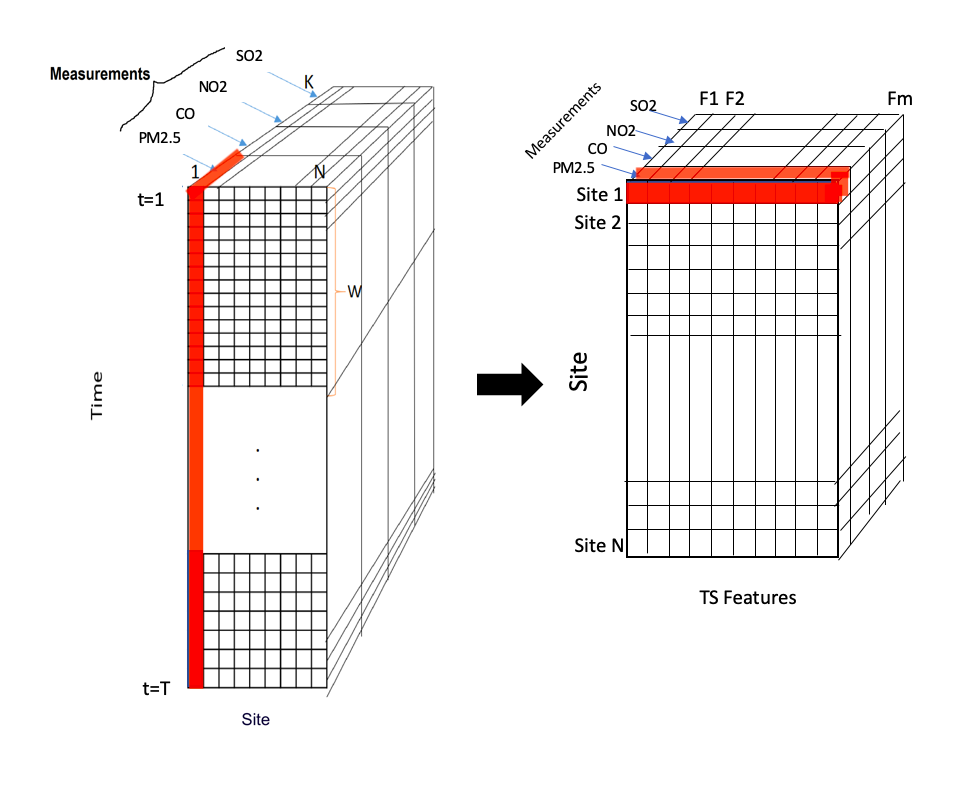
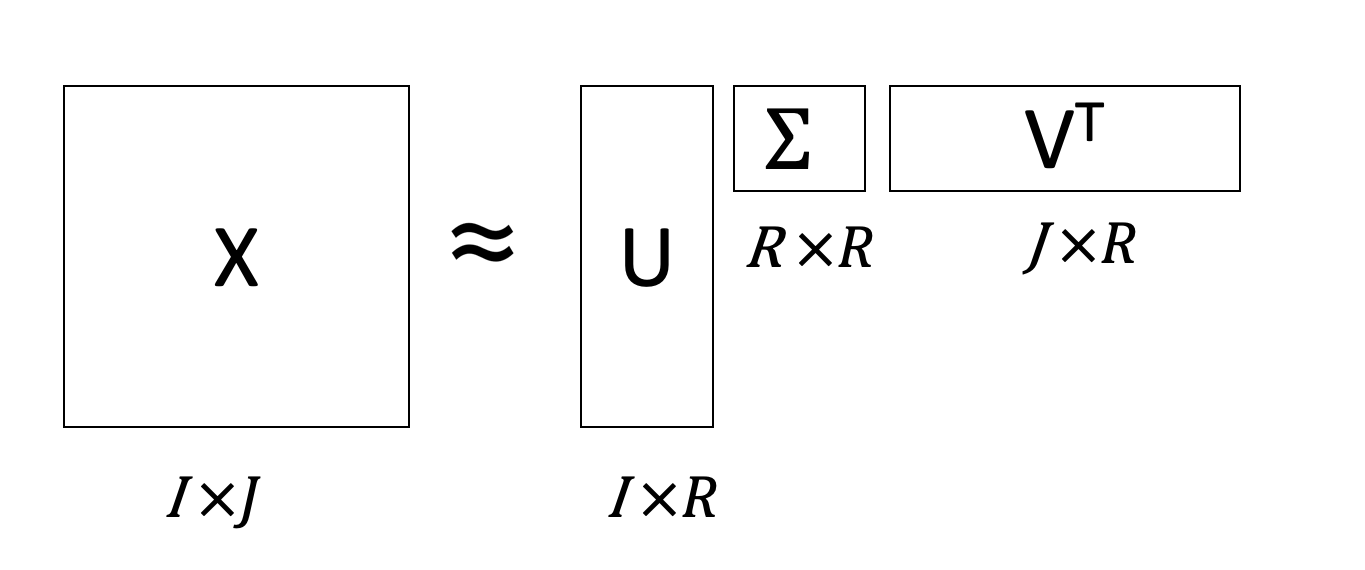
priyangad@uom.lk
pridiltal
<i class="fas fa-hand-point-right faa-horizontal animated faa-fast " style=" color:orange;"></i>
https://prital.netlify.app/ </br> (Slides available) ].pull-right[ <div class="figure" style="text-align: center"> <img src="figure/19_hexstickermask.png" alt="devtools::install_github("pridiltal/mask")" width="50%" /> <p class="caption">devtools::install_github("pridiltal/mask")</p> </div> ] .footnote[ Slides created via `xaringan`. ] --- ### Key References - Di Palma, M. A., V. Todorov, and M. Gallo. "Robust multiway analysis of compositional data in R." - Talagala, Priyanga Dilini, Rob J. Hyndman, and Kate Smith-Miles. "Anomaly detection in high-dimensional data." Journal of Computational and Graphical Statistics (2020): 1-15. - Talagala, P. D., Hyndman, R. J., Smith-Miles, K., Kandanaarachchi, S., & Munoz, M. A. (2020). Anomaly detection in streaming nonstationary temporal data. Journal of Computational and Graphical Statistics, 29(1), 13-27.