Detection of Anomalous Series Within a Large Collection of Streaming Time Series Data
Priyanga Dilini Talagala
with
Rob J Hyndman
Kate Smith-Miles
Sevvandi Kandanaarachchi
Mario A. Muñoz
Monash University
1 / 21
Motivation: Fence-mounted perimeter intrusion detection systems

- Data obtained using fiber optic cables attached to a fence
2 / 21
Motivation: Fence-mounted perimeter intrusion detection systems

- Data obtained using fiber optic cables attached to a fence
- Intrusion events cause measurable changes in intensity, phase, wavelength or transit time of light in the fiber.
2 / 21
Motivation: Fence-mounted perimeter intrusion detection systems

- Data obtained using fiber optic cables attached to a fence
- Intrusion events cause measurable changes in intensity, phase, wavelength or transit time of light in the fiber.
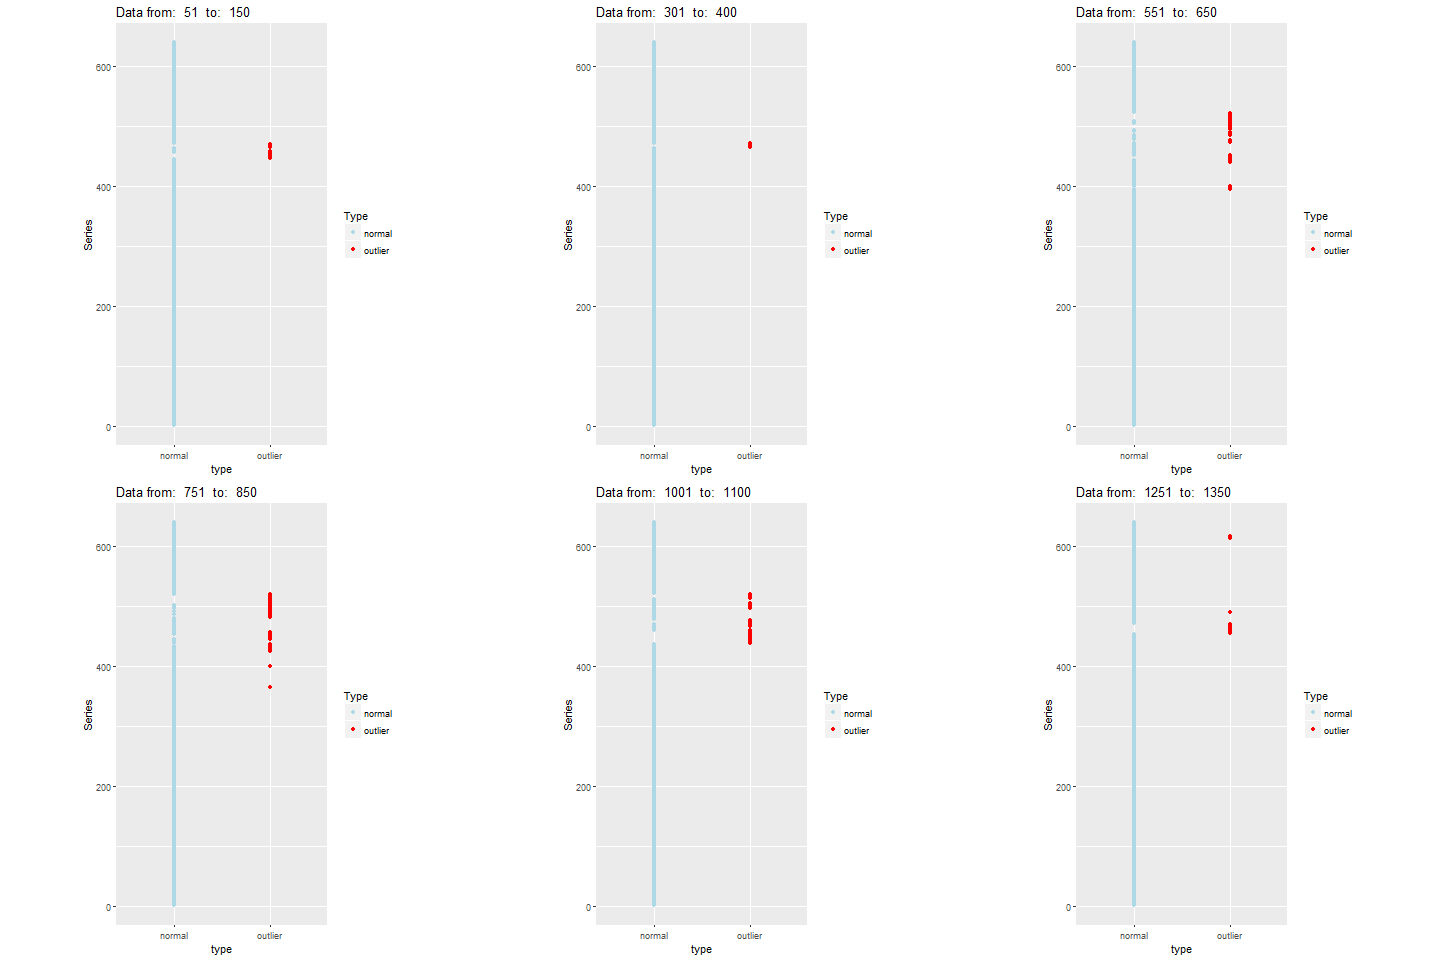
- Aim: Find anomalous time series (the location of the intrusion event)
2 / 21
- Approaches to solving the problem of anomaly detection for temporal data :
3 / 21
- Approaches to solving the problem of anomaly detection for temporal data :
Batch scenario:
whole set of data is available, focus - complete events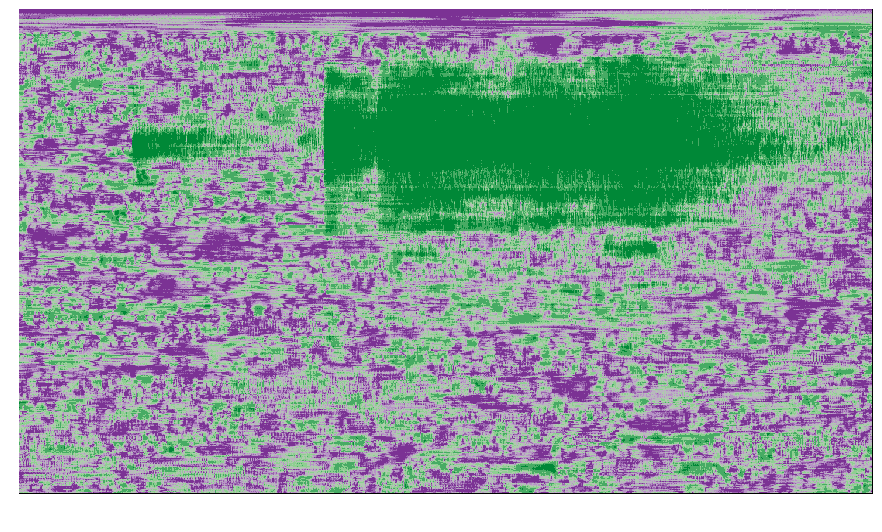
3 / 21
- Approaches to solving the problem of anomaly detection for temporal data :
Batch scenario:
whole set of data is available, focus - complete events
Data stream scenario: continuous, unbounded, flow at high speed, high volume
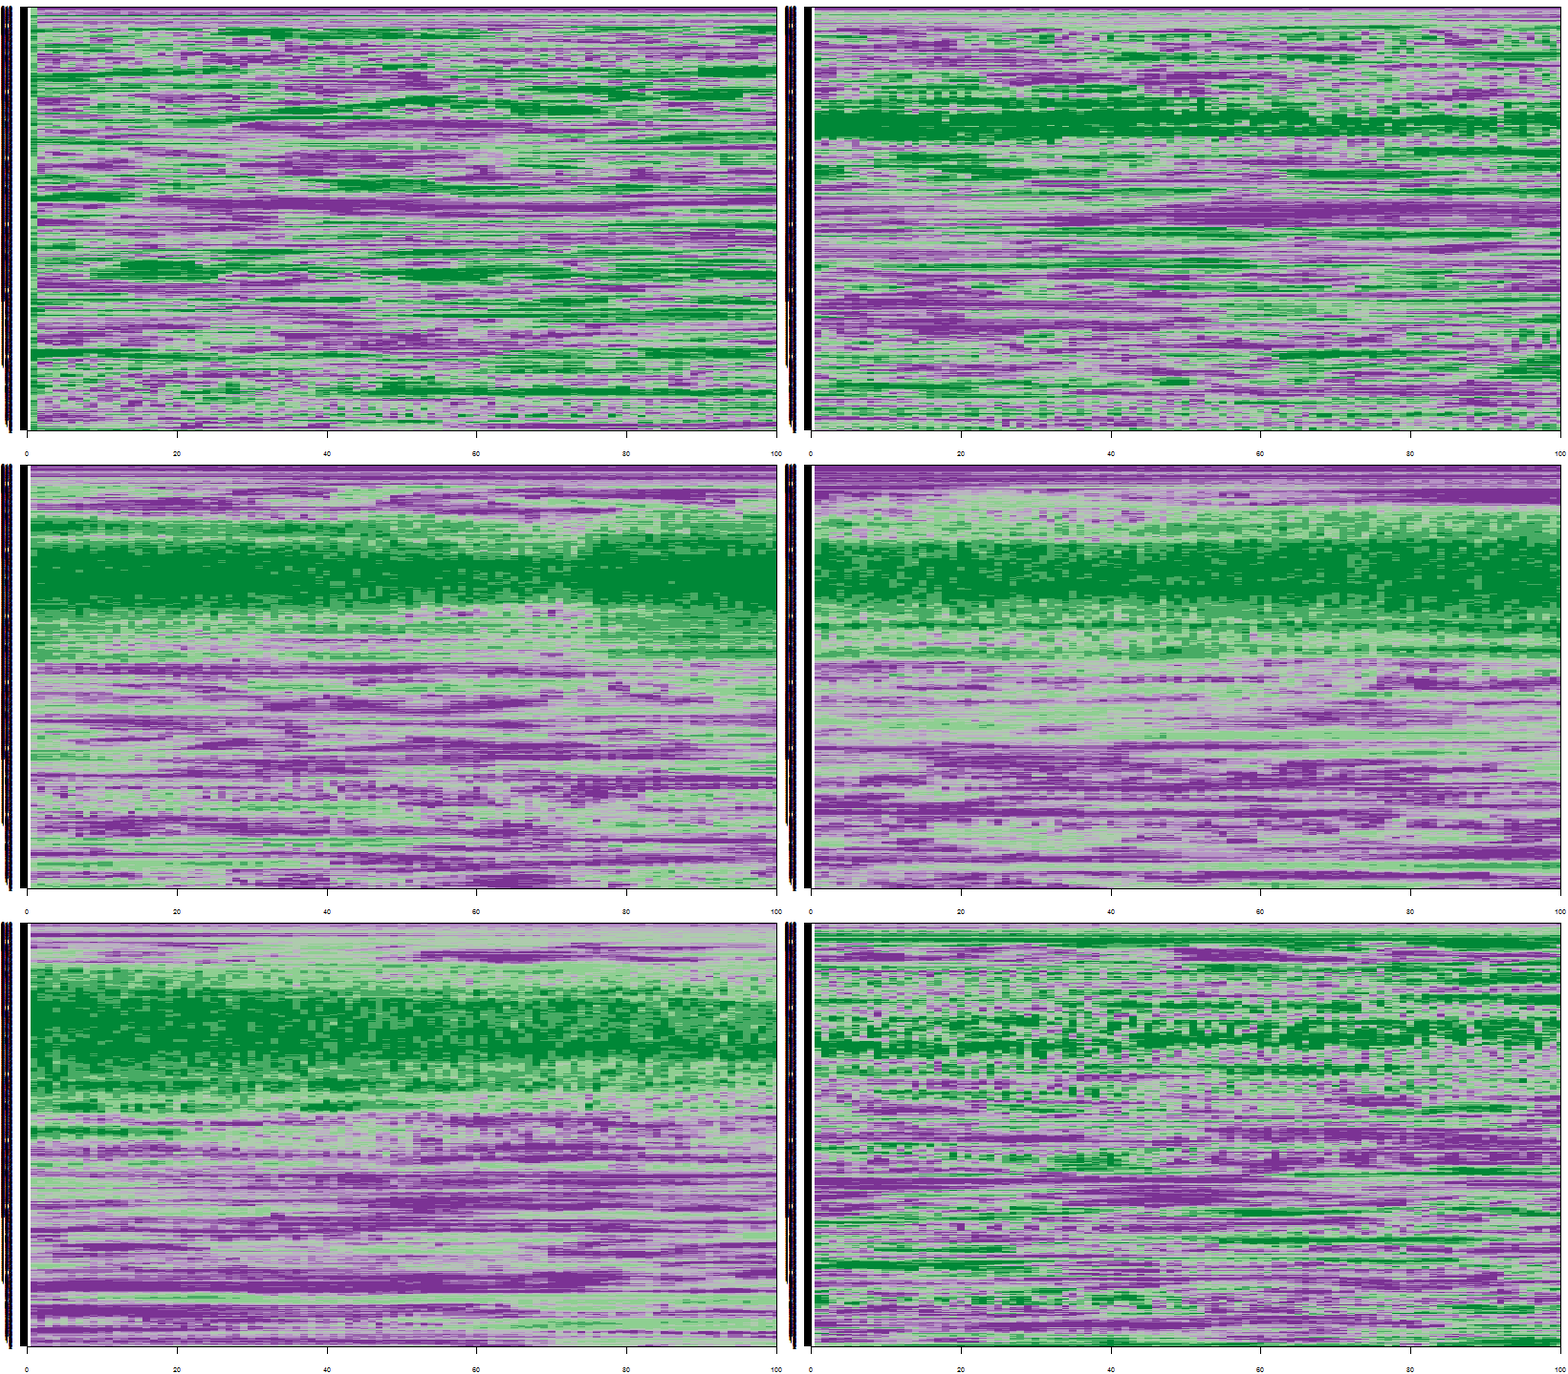
3 / 21
Automatic anomaly detection algorithm for streaming data is required:
- to give real-time support
4 / 21
Automatic anomaly detection algorithm for streaming data is required:
- to give real-time support
- to provide early detection of anomalies
4 / 21
Automatic anomaly detection algorithm for streaming data is required:
- to give real-time support
- to provide early detection of anomalies
- to learn and adapt to the changing environment automatically (concept drift)
4 / 21
Automatic anomaly detection algorithm for streaming data is required:
- to give real-time support
- to provide early detection of anomalies
- to learn and adapt to the changing environment automatically (concept drift)
- to deal with large amounts of data efficiently
4 / 21
What is an anomaly ?
5 / 21
Image credit: Wikimedia Commons
What is an anomaly ?
- By definition, anomalies are rare in comparison to a system's typical behaviour.
- We define an anomaly as an observation that is very unlikely given the forecast distribution.
6 / 21
Algorithm of the proposed framework
Aim
- To detect anomalous time series within a large collection of time series in a streaming data context
7 / 21
Algorithm of the proposed framework
Aim
- To detect anomalous time series within a large collection of time series in a streaming data context
Main Assumptions
7 / 21
Algorithm of the proposed framework
Aim
- To detect anomalous time series within a large collection of time series in a streaming data context
Main Assumptions
- Anomaly is a rare event which has a very low chance of occurrence with respect to the typical behavior of the system
7 / 21
Algorithm of the proposed framework
Aim
- To detect anomalous time series within a large collection of time series in a streaming data context
Main Assumptions
- Anomaly is a rare event which has a very low chance of occurrence with respect to the typical behavior of the system
- A representative data set of the system's typical behavior is available to define the model for the typical behavior of the system.
Proposed Algorithm
- Off-line Phase: Building a model of a system's typical behaviour; (similar to (Clifton, Hugueny & Tarassenko, 2011))
- On-line Phases: Testing newly arrived data using the boundary
7 / 21
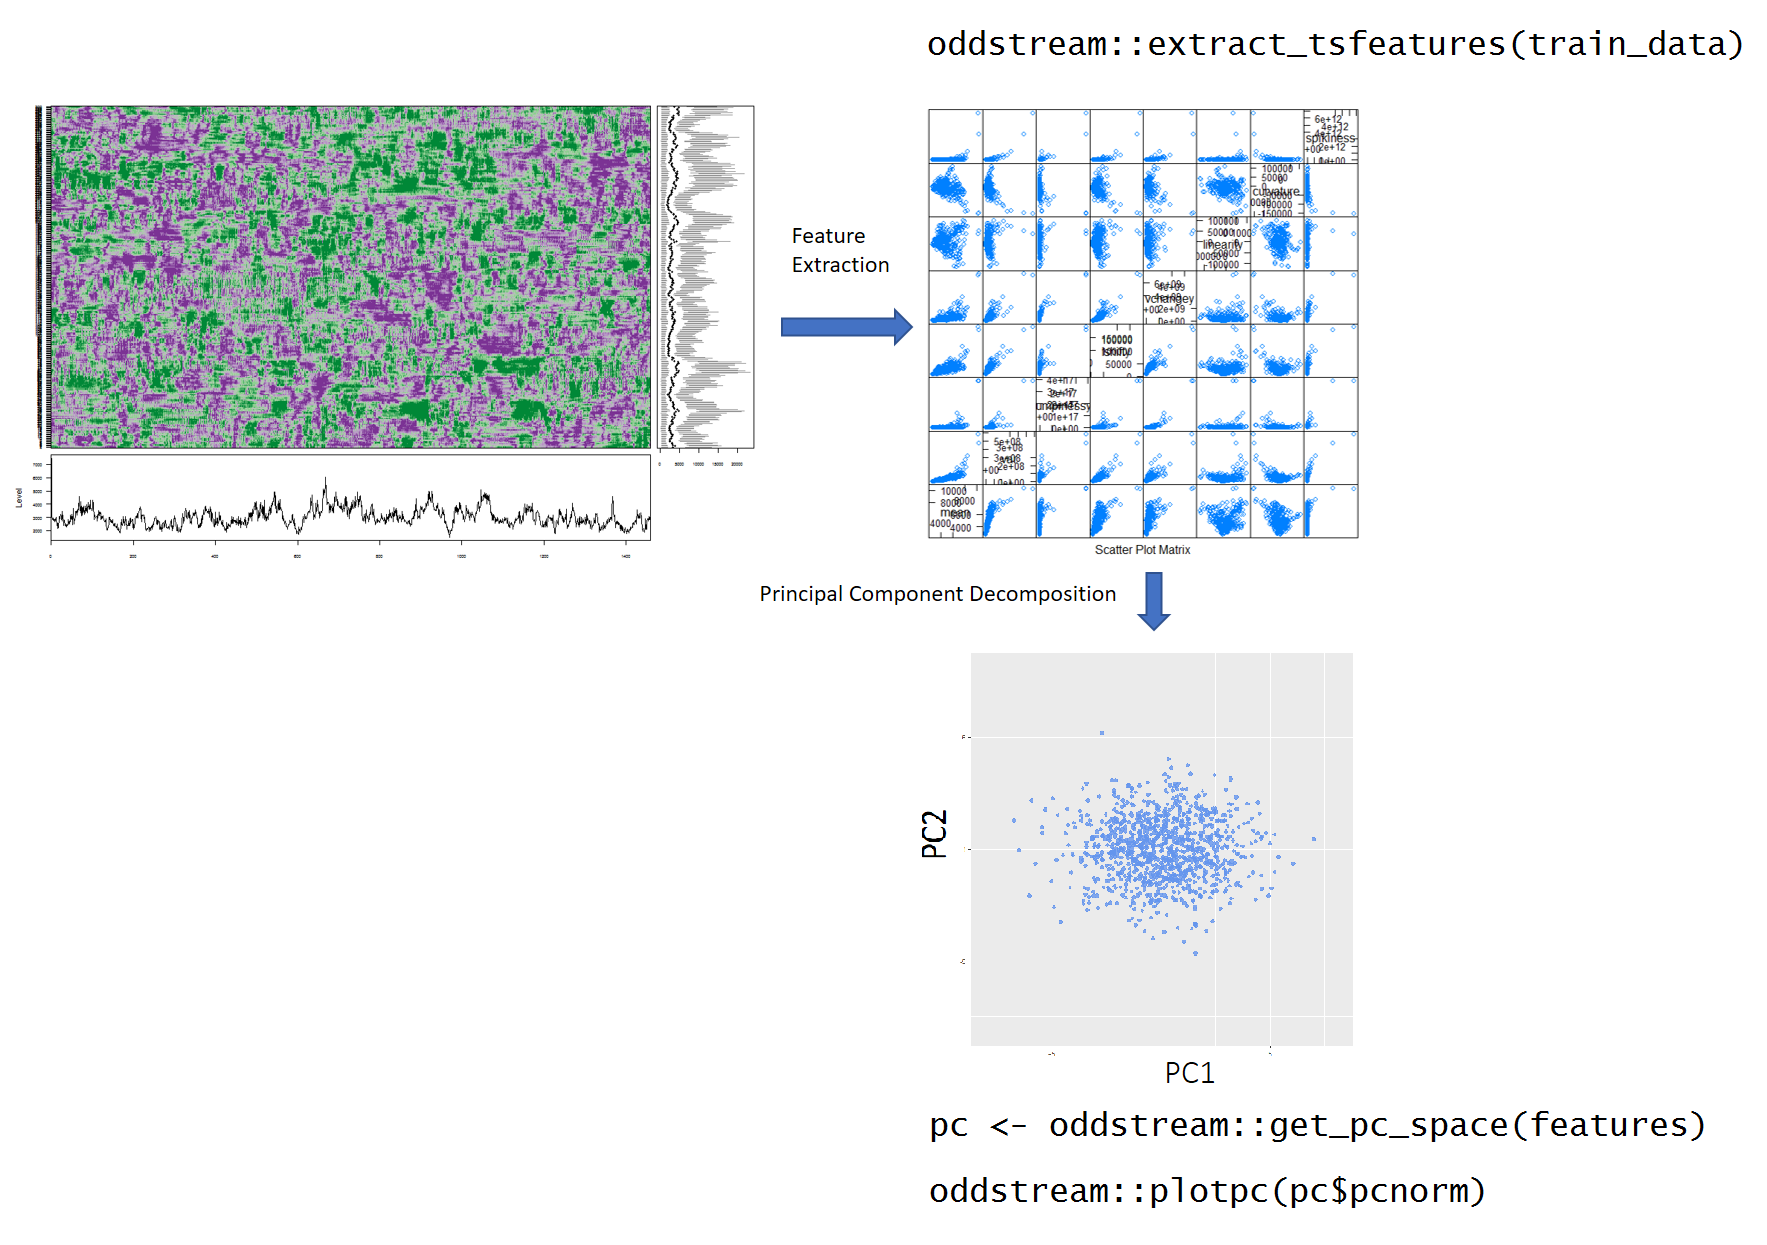
Feature Based Representation of Time series
- Mean
- Variance
- Changing variance in remainder
- Level shift using rolling window
- Variance change
- Strength of linearity
- Strength of curvature
- Strength of spikiness
- Burstiness of time series (Fano Factor)
- Minimum
- Maximum
- The ratio between interquartile mean and the arithmetic mean
- Moment
- Ratio of means of data that is below and upper the global mean
8 / 21
Feature Based Representation of Time series
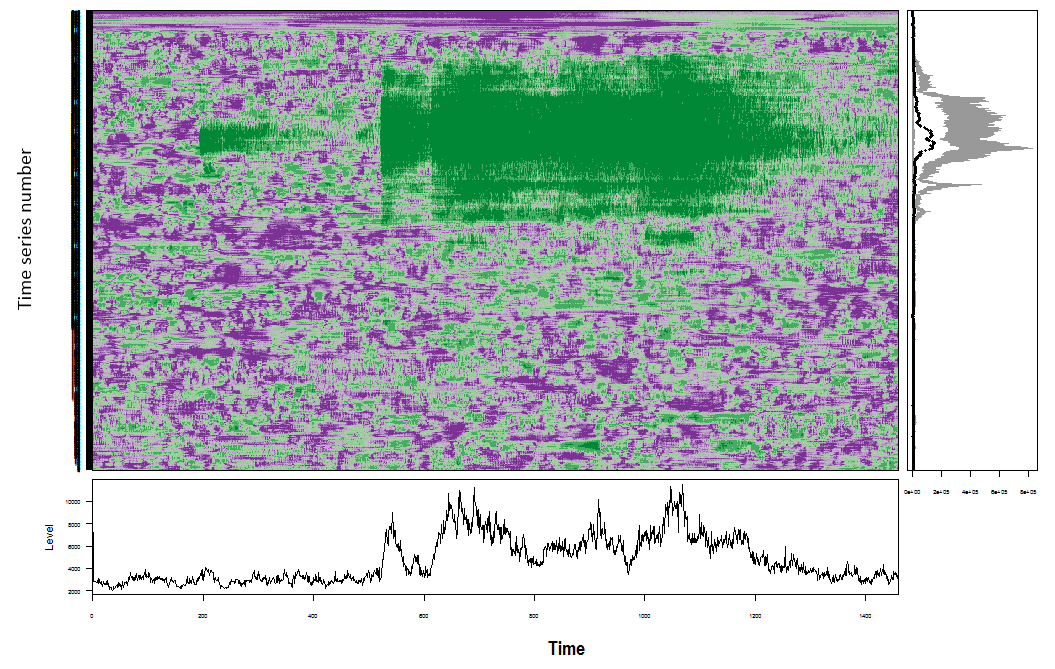
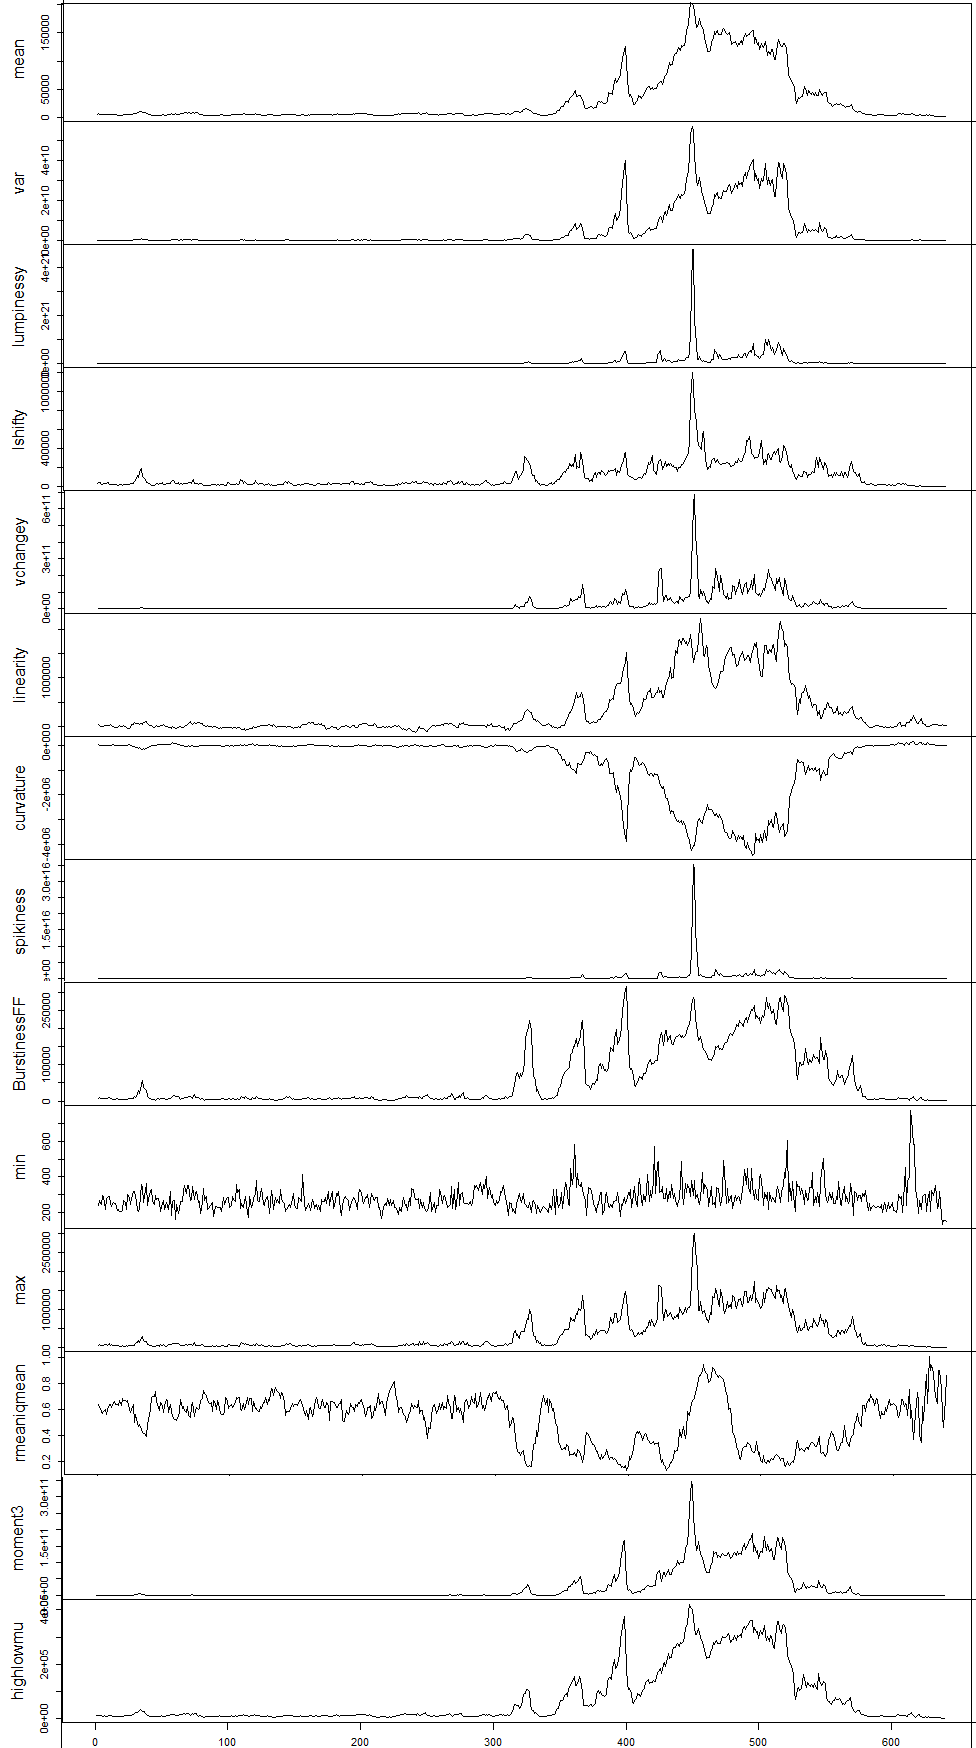
9 / 21
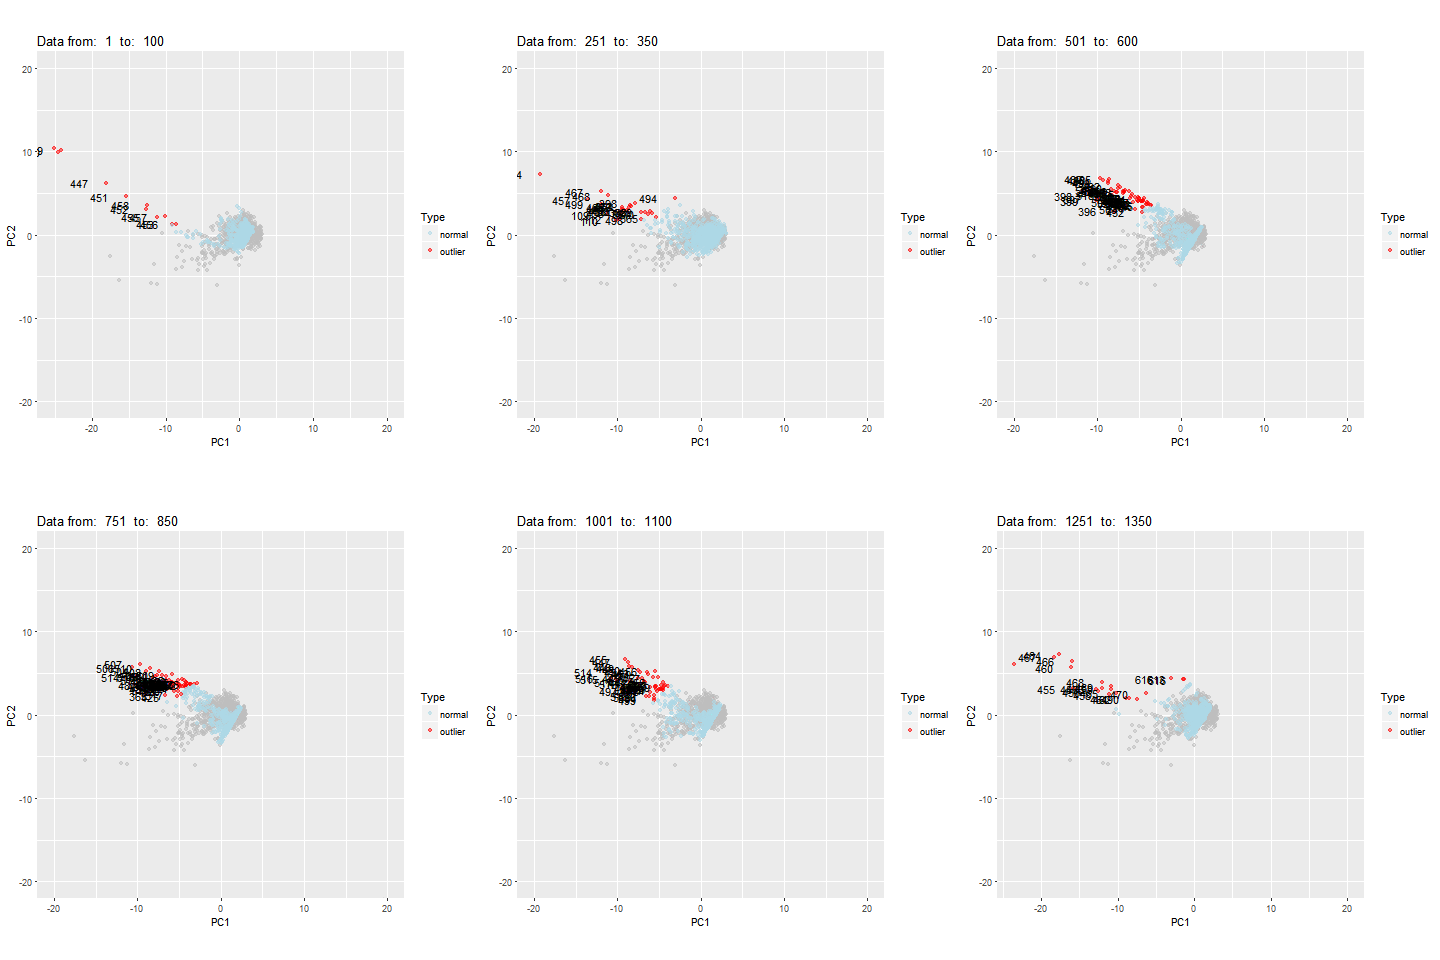
Dimension Reduction for Time Series
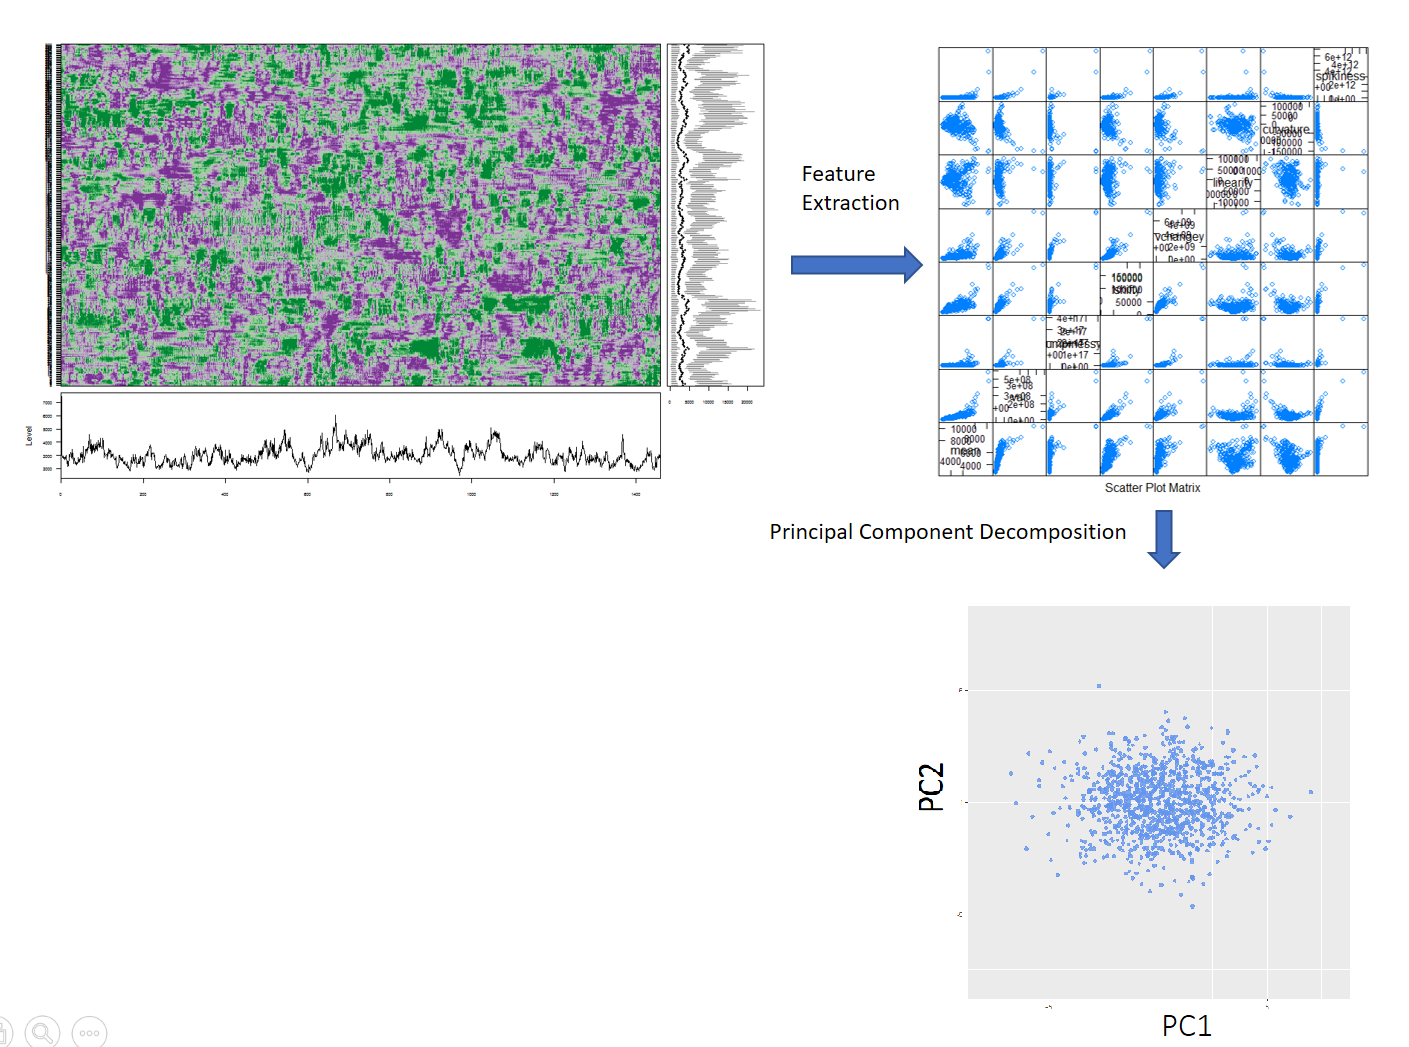
- First two PCs explain 85% of variation
10 / 21
Off-line Phase:
- Estimate the probability density function of the 2D PC space --> Kernel density estimation
- Draw a large number N of extremes from the estimated probability density function
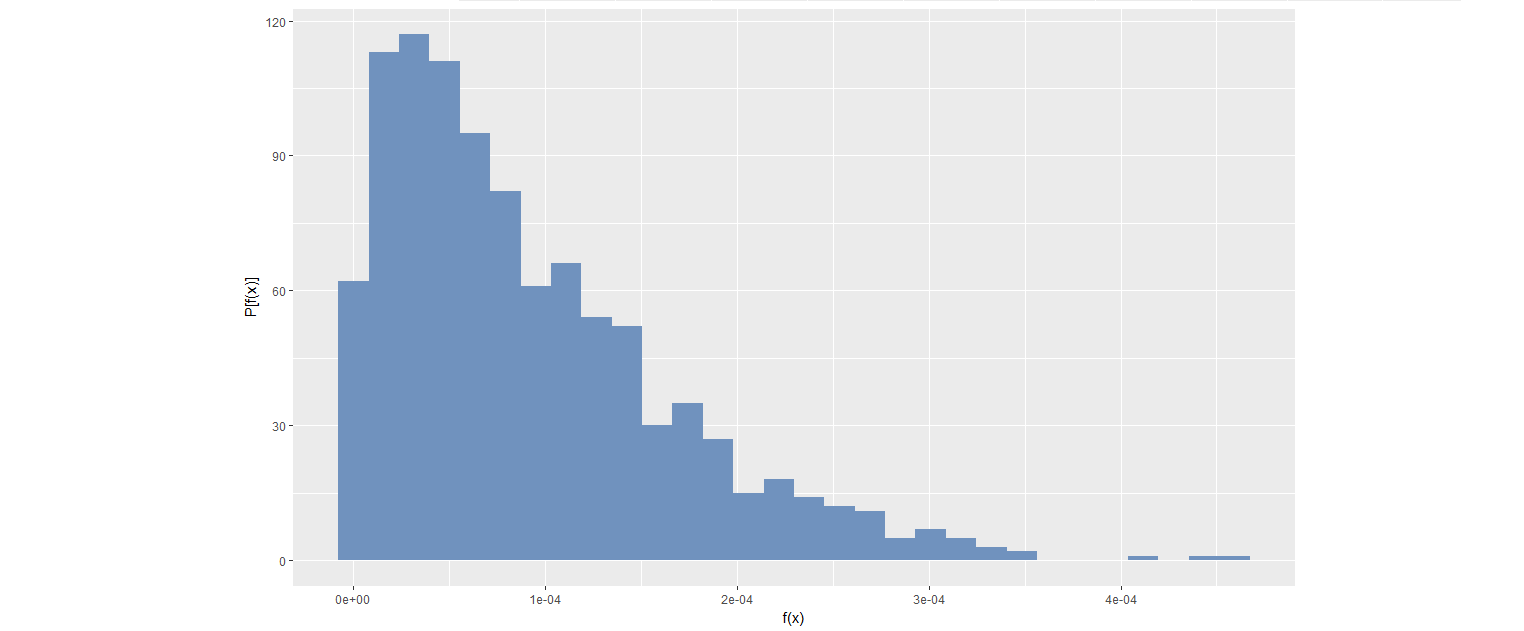
Figure: Distribution of 1000 extremes generated from bivariate kernel density function with m=500
11 / 21
Off-line Phase:
- Define a
Ψ-transform space, using theΨ-transformation defined by

Ψ-transform maps the density values back into space into which a Gumbel distribution can be fitted.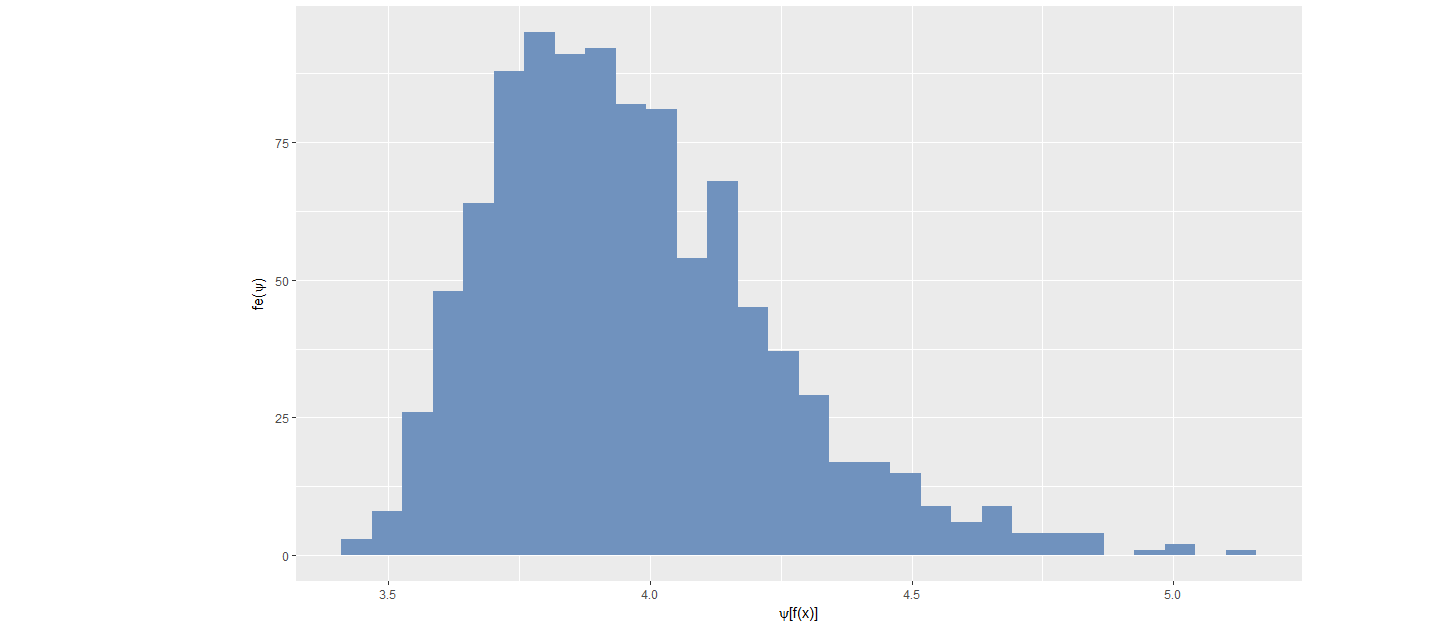
Figure: Distribution of transformed values
12 / 21

13 / 21
Image credit: Wikimedia Commons
14 / 21
How it works?

15 / 21
How it works?
16 / 21
oddstream::find_odd_streams(train_data, test_stream)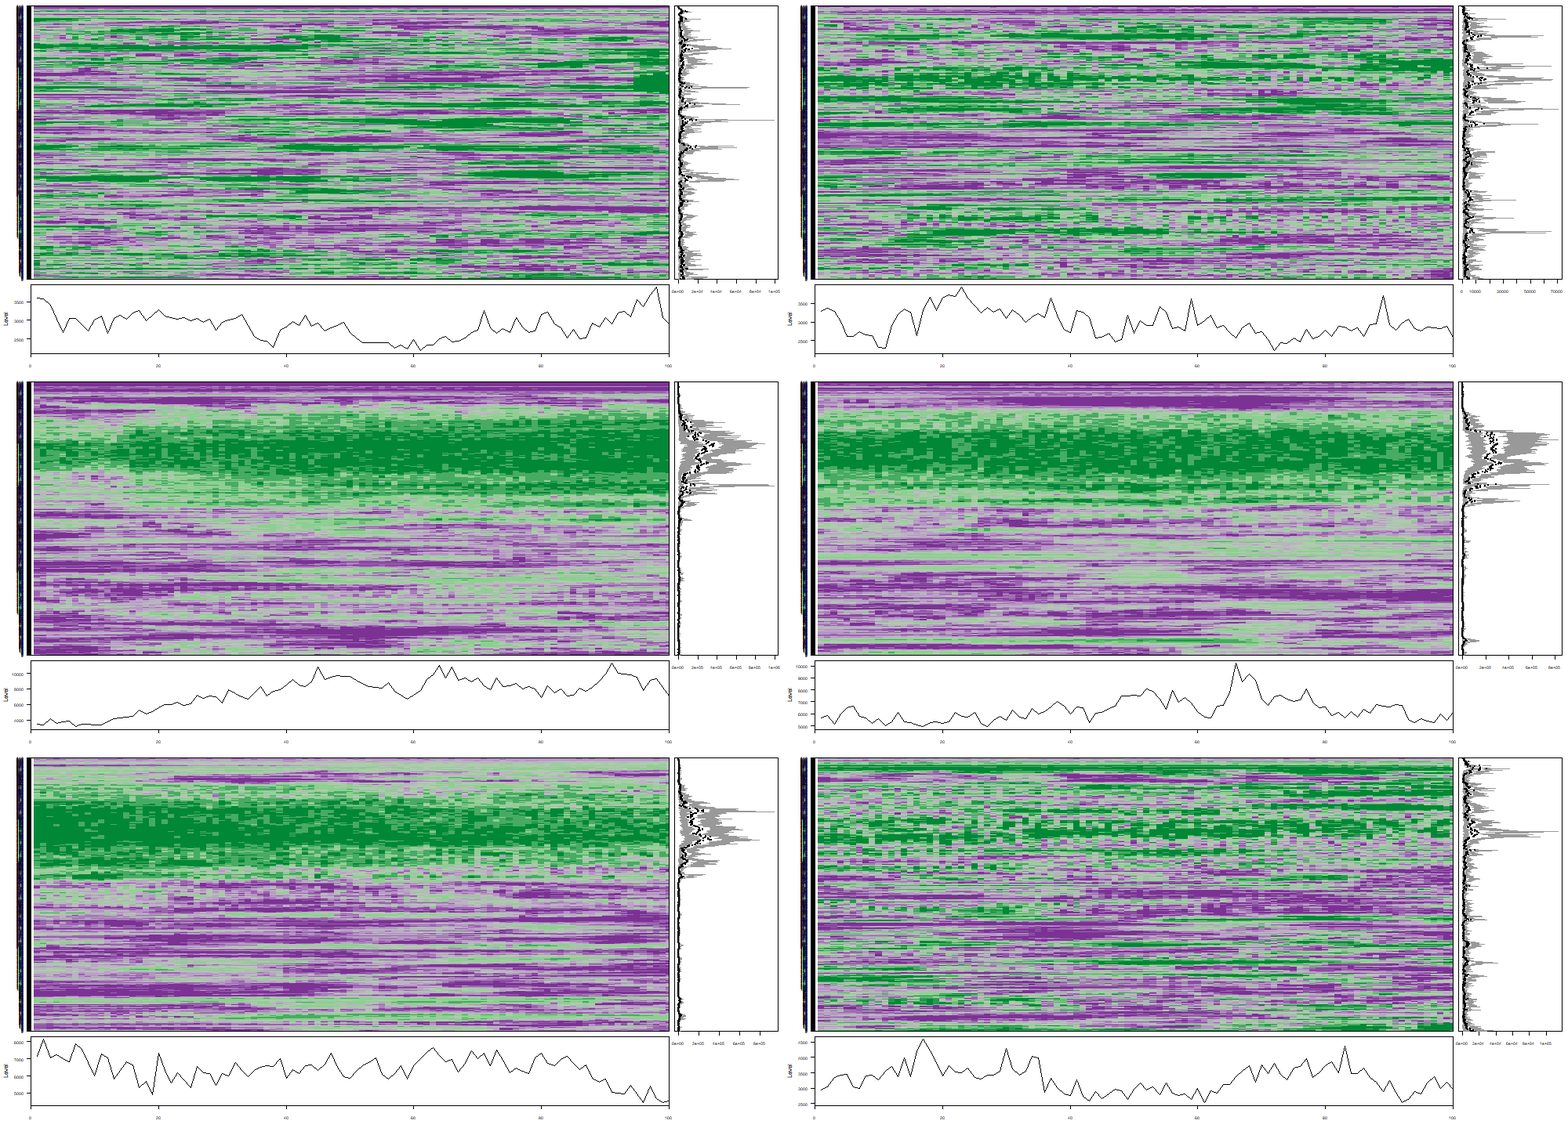
17 / 21
What Next?
- Explore more on feature extraction and feature selection methods to create a better feature space suitable for streaming data context.
18 / 21
What Next?
- Explore more on feature extraction and feature selection methods to create a better feature space suitable for streaming data context.
- Use other dimension reduction techniques such as multidimensional scaling analysis, random projection to see the effect on the performance of the proposed framework.
- Do more experiments on density estimation methods to get a better tail estimation.
- Extend the algorithm to work with Multidimensional Multivariate Data Streams.
18 / 21
References
Images were taken:
- http://55ca7cd0-f8ac-0132-1185-705681baa5c1.s3-website-sa-east-1.amazonaws.com/defesanet/site/upload/news_image/2016/03/30157.jpg
- https://www.intel.co.uk/content/dam/www/public/emea/xe/en/images/it-managers/datacenter-corridor-16x9.jpg.rendition.intel.web.1280.720.jpg
- https://fibersensys.com/cache/mod_roksprocket/4d90594c170e9ec140017f0719ce2c98_350_900.jpg
- https://c1.staticflickr.com/8/7065/26946304530_cb30c23660_b.jpg
Main references
- Clifton, D. A., Hugueny, S., & Tarassenko, L. (2011). Novelty detection with multivariate extreme value statistics. Journal of signal processing systems, 65 (3), (pp. 371-389).
- Fulcher, B. D. (2012). Highly comparative time-series analysis. PhD thesis, University of Oxford.
- Hyndman, R. J., Wang, E., & Laptev, N. (2015). Large-scale unusual time series detection. In 2015 IEEE International Conference on Data Mining Workshop (ICDMW), (pp. 1616-1619). IEEE.
19 / 21
Acknowledgement
Statistical Society of Australia, Victorian Branch
- for offering financial support to attend the Young Statisticians Conference (YSC) 2017 in Coolangatta, QLD.
20 / 21
Thank You
R package available at: github.com/pridiltal/oddstream
Email: dilini.talagala@monash.edu
Slides available at: http://pritalagala.netlify.com/talk/yscvicbranch2017-talk/
21 / 21